Introducing Dashboards
To make your day-to-day tasks easier, we have introduced new dashboards that allow you to quickly assess data at a glance and make informed decisions in seconds.
Sophie RennEditorial Lead
|April 11, 2024|3 min read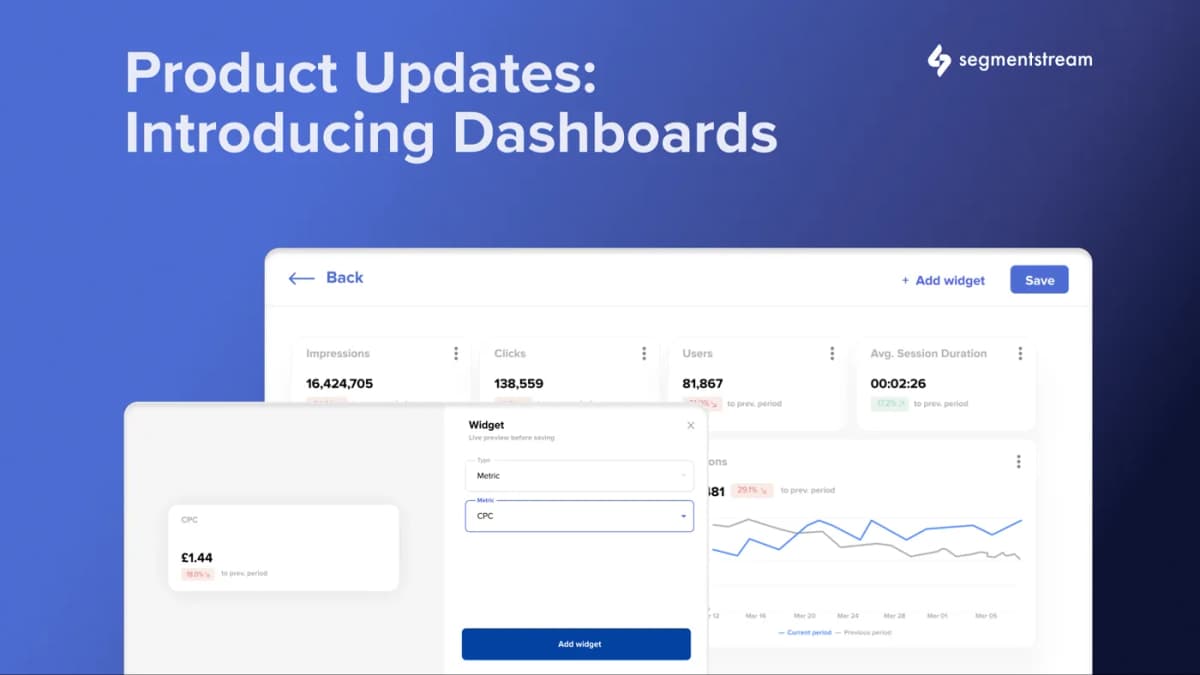
Dashboards Overview
We are delighted to announce the launch of Dashboards. This addition will change the way our customers engage with their data, providing a more intuitive and efficient overview of their project performance.
Benefits of Dashboards
The introduction of Dashboards brings numerous benefits to the table:
- Increased flexibility: Tailor your analytical view to meet your specific marketing objectives. Create as many as you need; mix and match dashboards to evaluate different aspects of your performance.
- All data on one page: Effortlessly navigate through your data and make quick yet informed strategic decisions without having to open and compare data in separate reports.
Watch the detailed demo video that walks you through the functionality of Dashboards.
How Does it Work?
From the initial setup to creating customised dashboards, every step is designed to be easy to use. Getting started with dashboards is simple
- First, sign in to the SegmentStream platform. Find Dashboards: Look for the "Dashboards" tab in the main menu to open the dashboard module.
- You'll see a simple default Dashboard to start with.
- To make changes, head to the menu in the upper right corner and select “Edit.” From there, you can adjust existing widgets or add new ones to your Dashboard. To add, simply click “Add widget” found at the top right of your screen.
Learn more about the Dashboards by exploring the Docs
Available Types of Widgets: Line Chart and Metric
At the heart of our dashboards feature are widgets - the building blocks of your data visualisation. We are initially launching two types of widgets: Metric and Line Chart.
Metric Widgets
The Metric widget provides a clear, at-a-glance view of key performance indicators so you can quickly assess the success of your campaigns. These widgets are just the start. We understand that different businesses have different needs and challenges, which is why we are committed to expanding our widget offering.
The Line Chart Widget
The Line Chart widget provides a dynamic view of data over time, perfect for identifying trends and patterns in your marketing strategies.
Based on your feedback and requests, we will continue to add more specialised widgets to the dashboards to ensure you have all the tools you need to visualize your data in the most meaningful and actionable way for your business.
More enhancements: From “Reports” to “Attribution”
In our ongoing effort to make our platform as intuitive and user-friendly as possible, we've made an update to the terminology within SegmentStream. What was previously known as "Reports" has now been updated and renamed "Attribution". This change reflects our commitment to reflect the capabilities of the feature and its role in your marketing analytics journey.
Getting Started with Dashboards
Ready to change the way you digest your data? Dive into the Dashboards feature today and discover how it can improve your data analysis and strategic planning. Our Customer Success team is on hand to help with any customisation requirements.