
Build your own Google Analytics with Claude Code: a step-by-step tutorial
Replace Google Analytics with web analytics you own. Your coding agent builds it on SegmentStream from an open blueprint, adds the tracker to your website's code and deploys it with the SegmentStream CLI; you answer its questions, approve its plan and connect your ad accounts. Every prompt and screen from a real walkthrough.
SegmentStream team · Updated 17 November 2026 · 13 min read
- You get
- Your own tracker, sessions, channels, leads, ad costs and attribution in a SegmentStream workspace, with reports your team signs in to.
- Time
- An afternoon, most of it your agent working
- You need
- SegmentStream access · A coding agent such as Claude Code, Codex or Cursor that can edit your website's code · The SegmentStream CLI, which your agent installs
- Last walked through
- 17 November 2026, every step, on a real workspace
If you build with a coding agent such as Claude Code or Codex, you can replace Google Analytics with analytics you own in an afternoon. Give the agent a SegmentStream workspace and the open marketing analytics blueprint. It asks how your business works, adds a tracker and a cookie banner to your website's code, builds sessions, channels, leads, ad costs and attribution in your workspace, and deploys everything with the SegmentStream CLI. You answer its questions, approve its plan and connect your ad accounts.
Every prompt, question and screen on this page comes from one walkthrough we did end to end on a fresh workspace: what we pasted, what the agent asked and ran, and what we checked in SegmentStream Cloud.
Step 1: Get access and create your organization
SegmentStream access is by invitation today. Request access on segmentstream.com, then accept the invitation and create your account with Google or an email address.
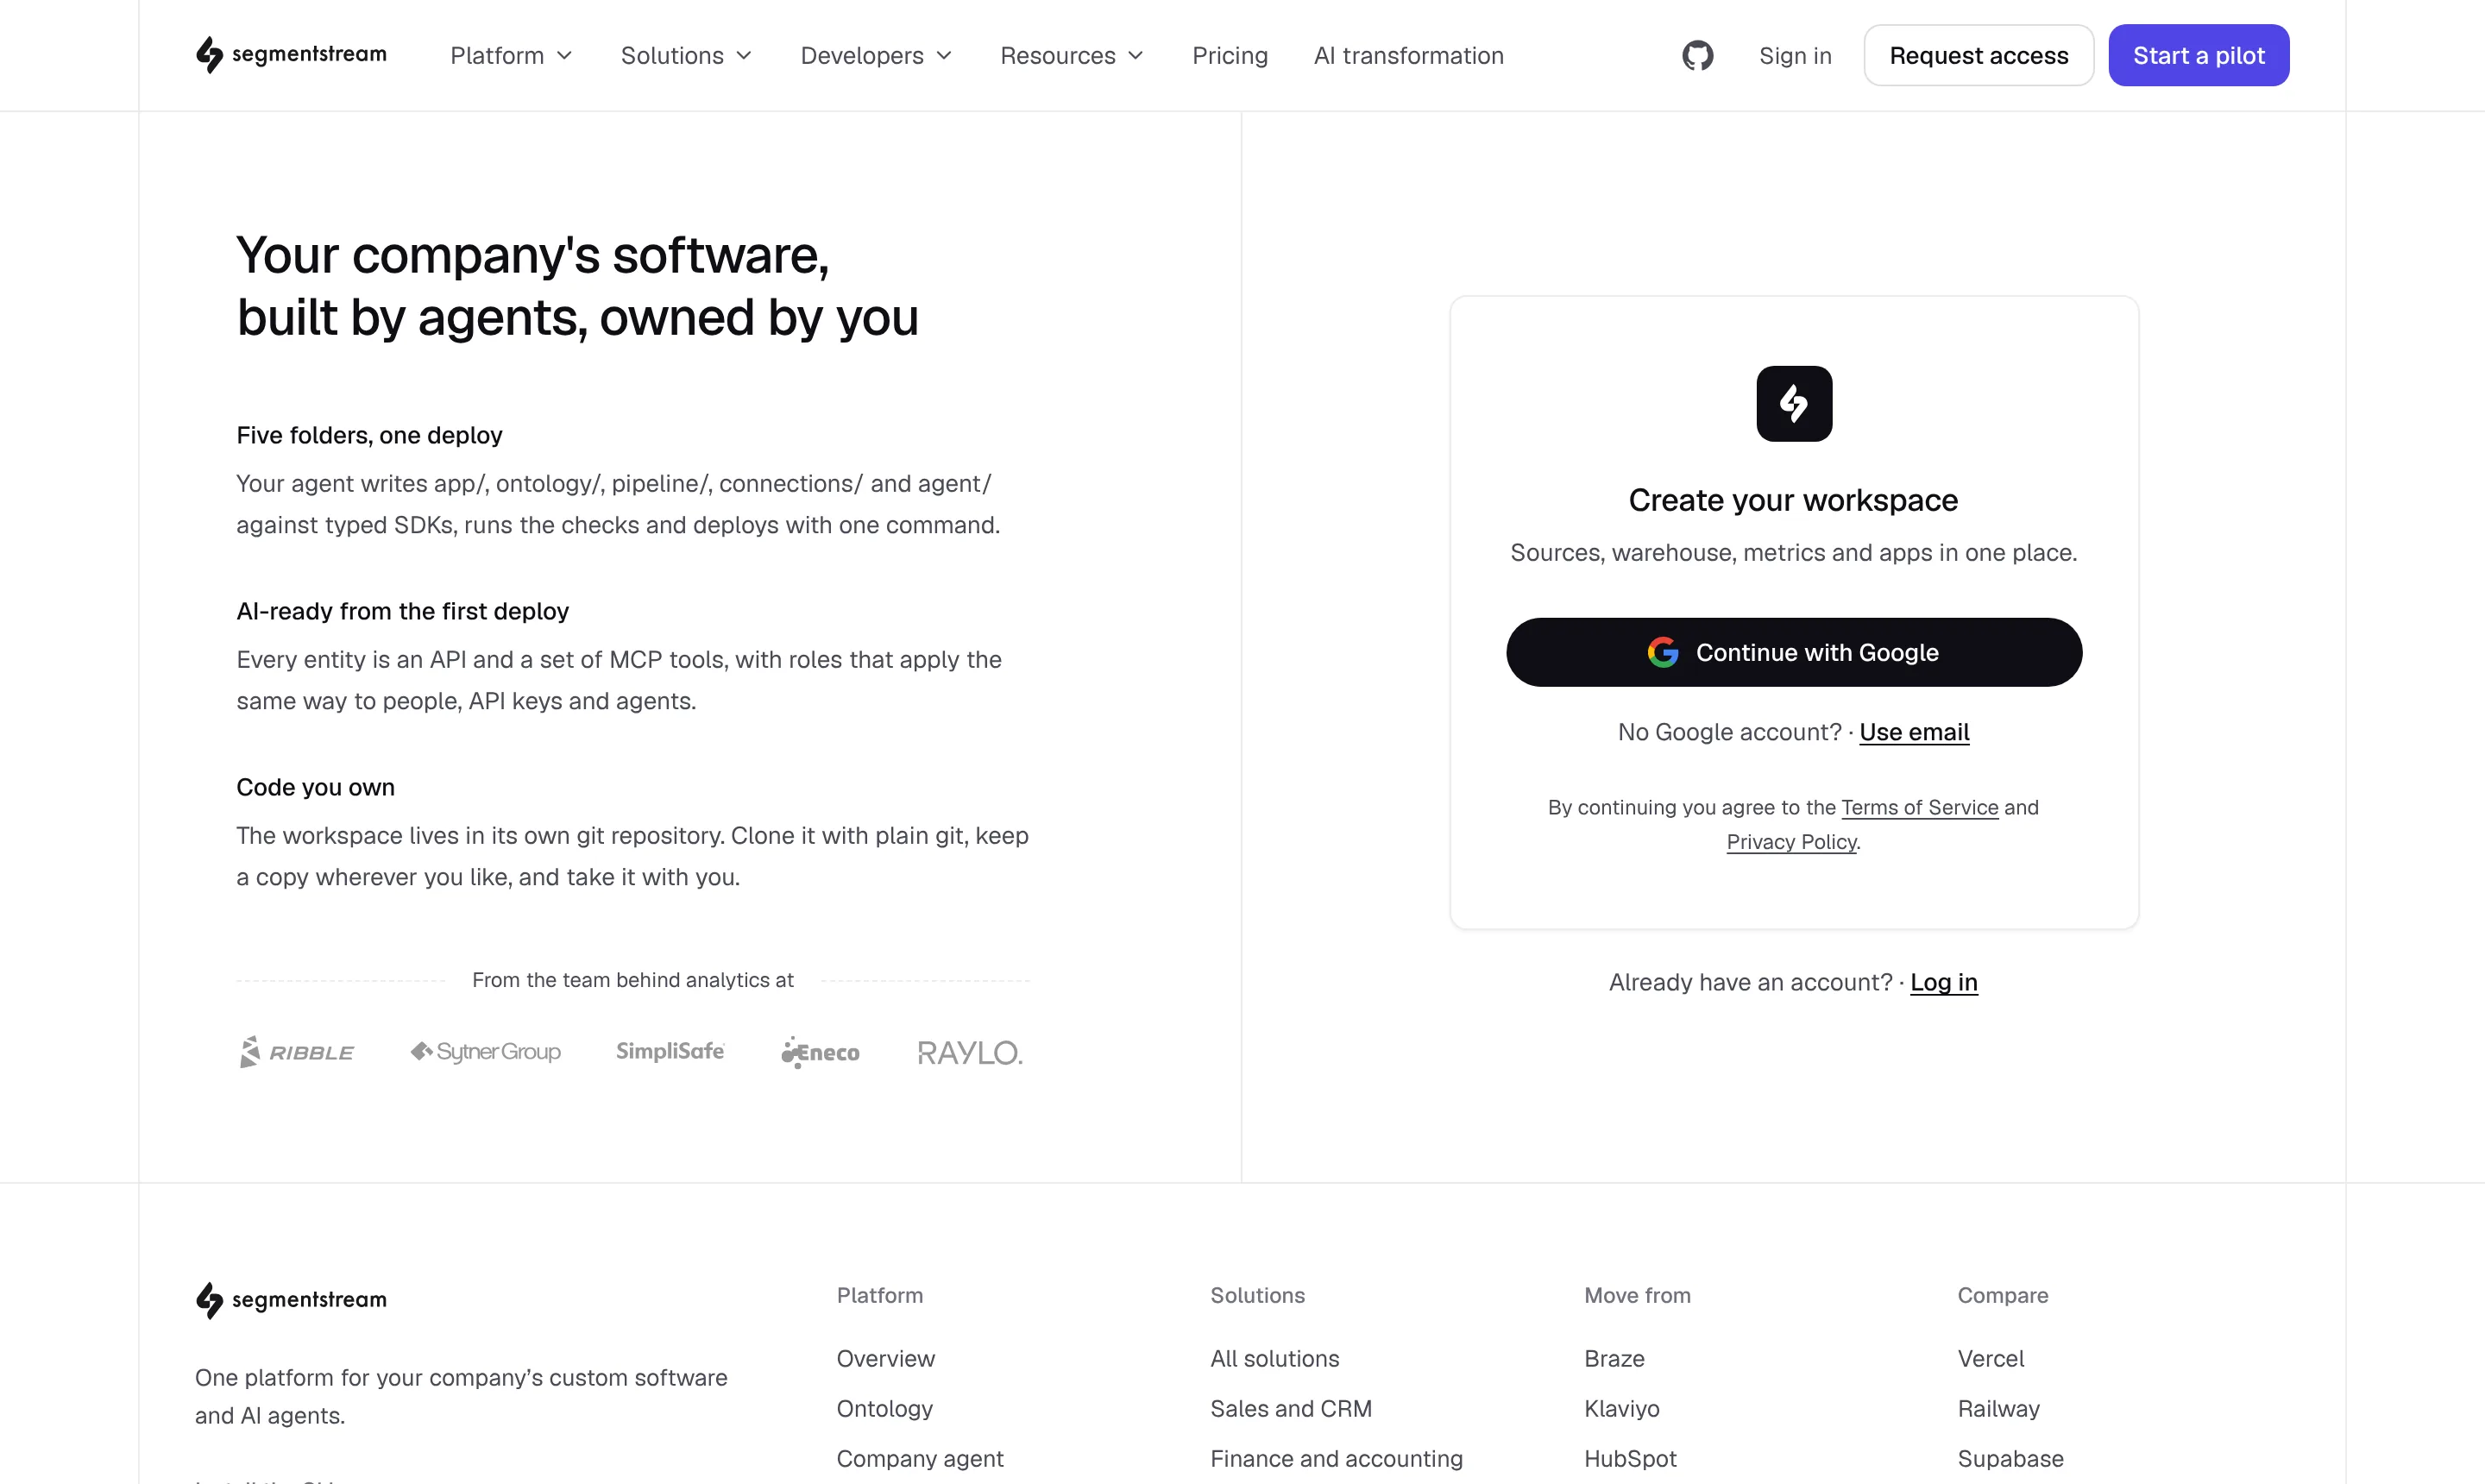
SegmentStream Cloud then asks for your organization's name and country. The organization holds your team, who may see what, and every workspace you create.
Step 2: Have your agent create a workspace
A workspace is your company's own software in one git repository: the event streams your site sends to, the warehouse, the pipelines that build reports, and the app your team opens. In SegmentStream Cloud, copy the setup prompt and paste it into your agent:
Read and follow https://segmentstream.com/agent-onboarding/SKILL.md
The agent installs the SegmentStream CLI, shows you a sign-in link to approve in your browser, and asks for the workspace's name, its app address, its region (Europe or the United States, which cannot be changed later) and a folder for the code. Then it creates the workspace and links the folder to it:
$ segmentstream init analytics
$ segmentstream workspace create analytics --region eu --subdomain acme-analytics
$ segmentstream link analytics --workspace <workspace-id>
The workspace's Git repository is now origin.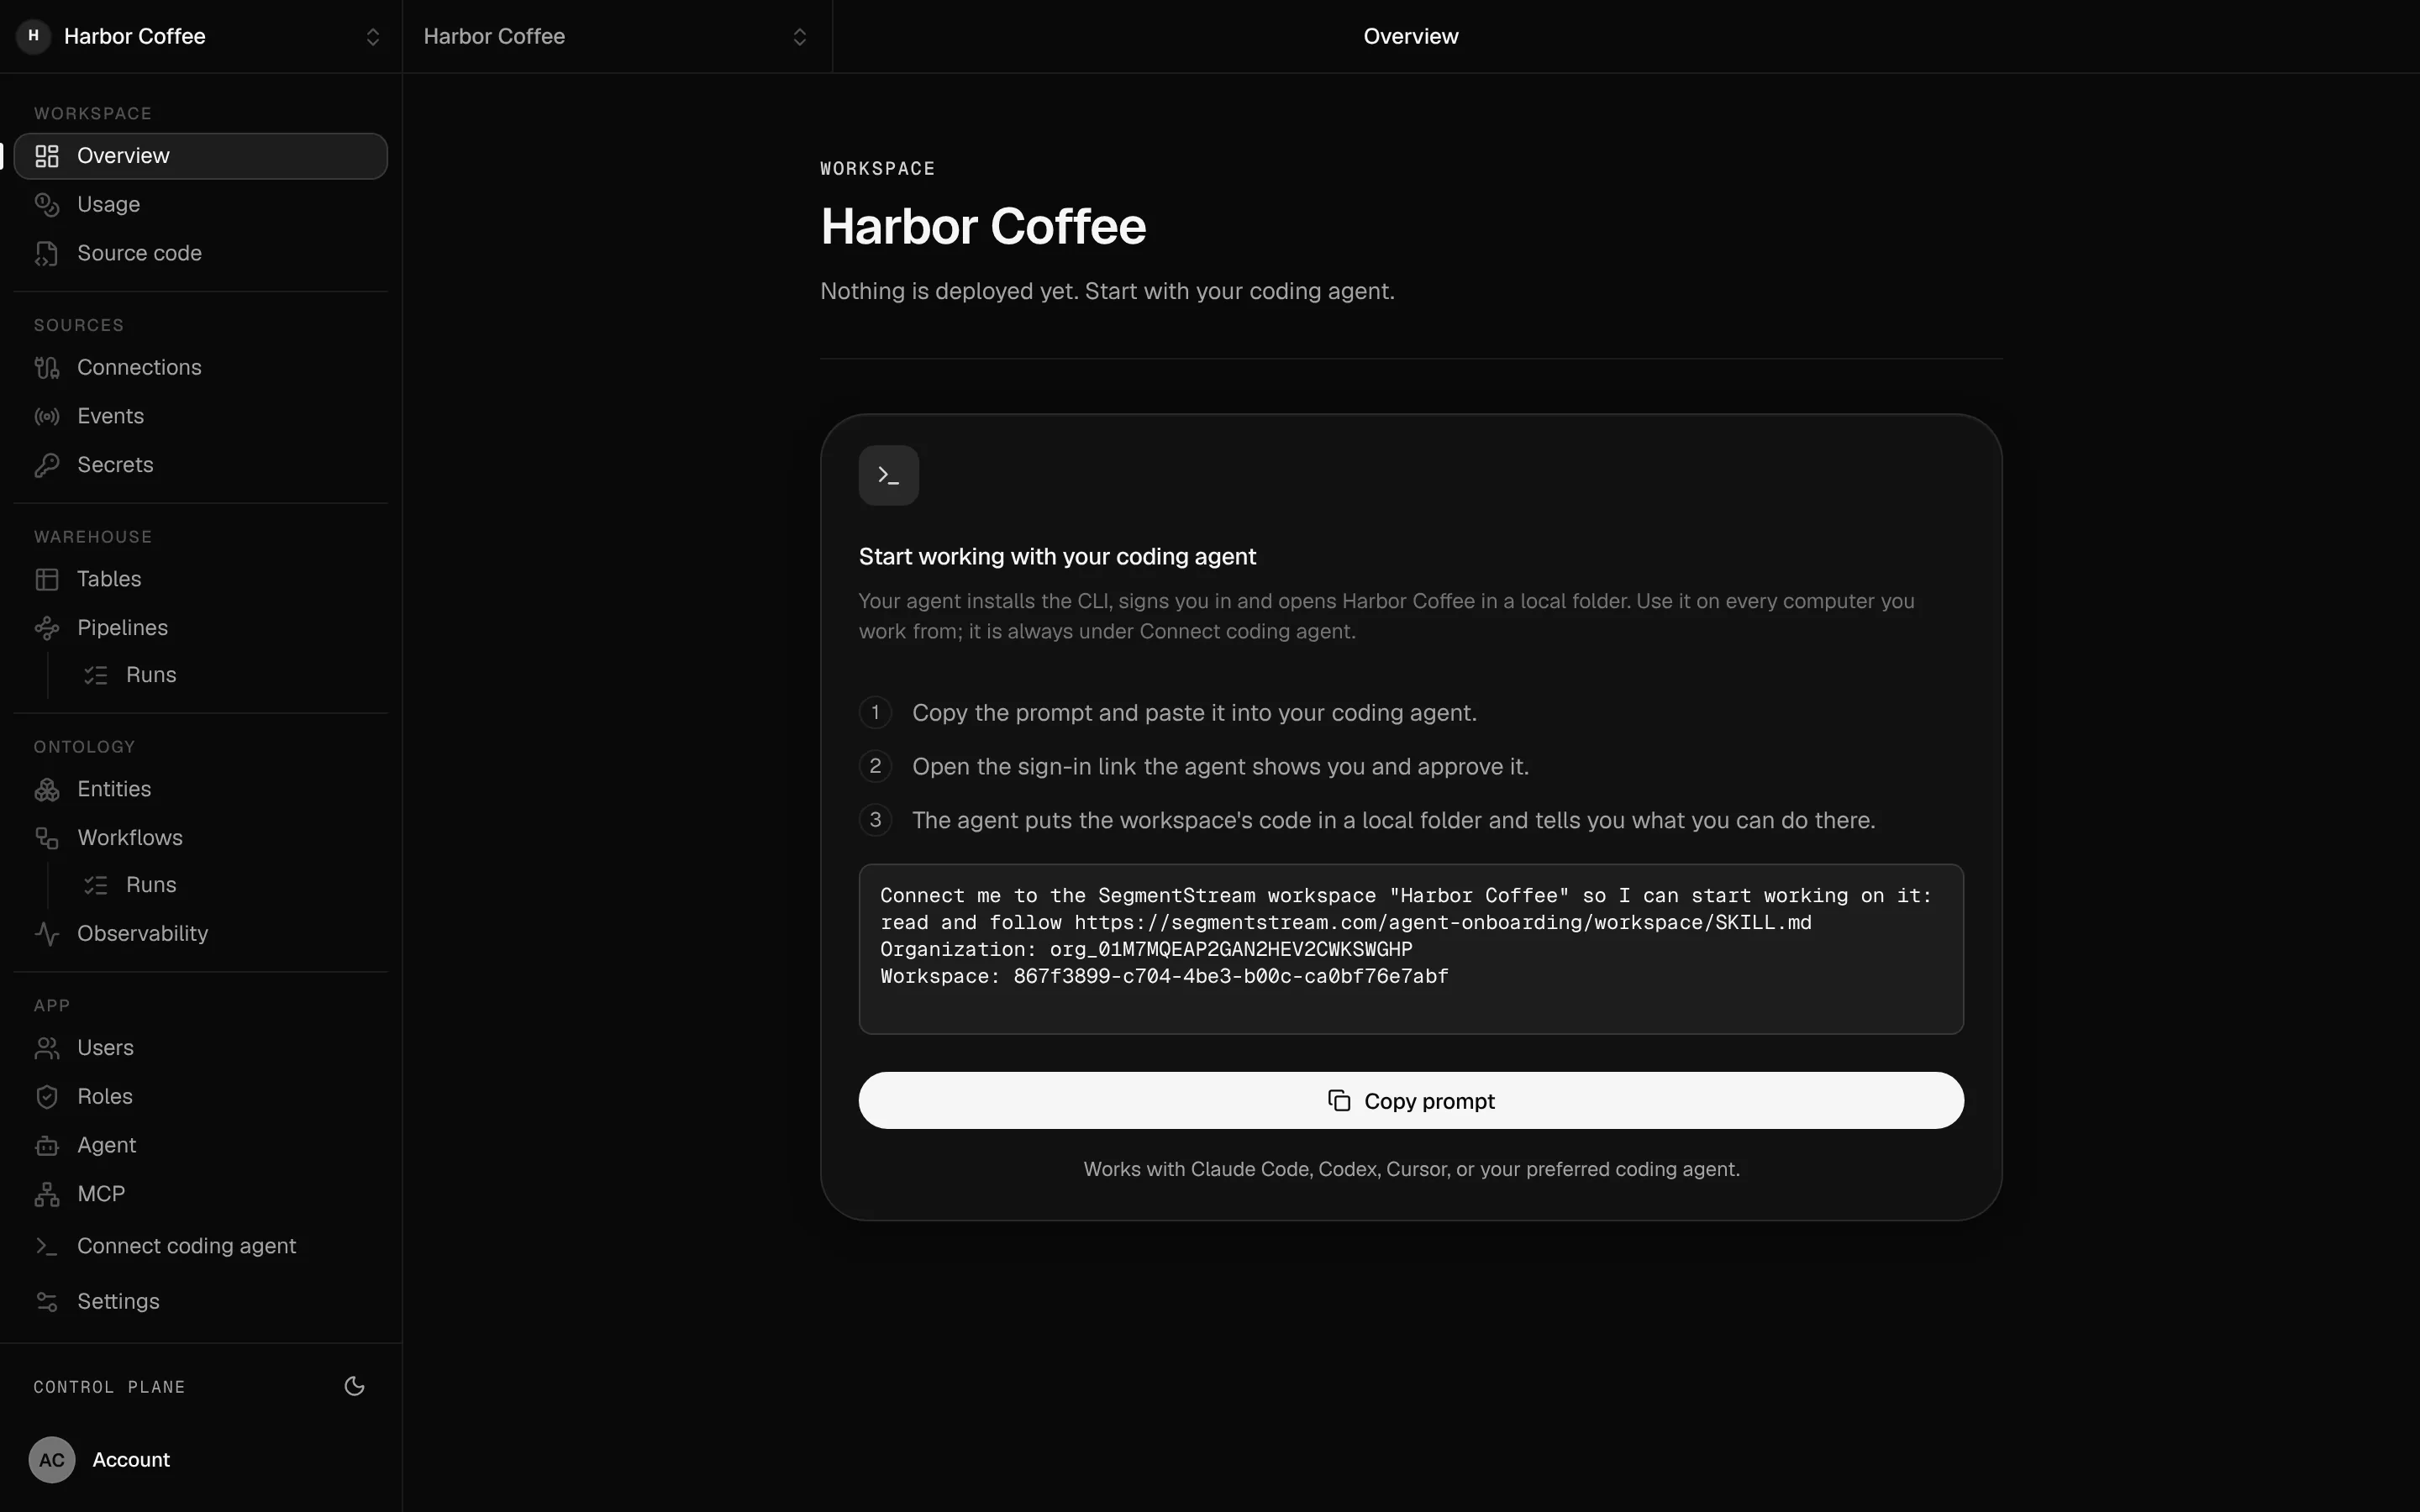
Check before you go on
- In SegmentStream Cloud, the workspace opens and says nothing is deployed yet.
- The agent reports the workspace's name, region and the folder it is linked to.
Step 3: Point the agent at your website and the blueprint
Start the agent where it can reach both the workspace folder and your website's repository, and paste the blueprint prompt with one line that says where your site is:
Read https://github.com/segmentstream/build-your-own/blob/main/AGENTS.md and follow it.
Build our Marketing analytics from the marketing-analytics blueprint.
Our website's code is in ../website. I publish the site myself.
The marketing analytics blueprint is an open design for web and marketing analytics: a first-party tracker, sessions, ad costs, conversions and attribution, with the rules every version has to keep. The agent reads it and your site's code before it asks anything: what the site is built with, whether it already has a cookie banner or an analytics tag, and which forms or purchases are its conversions.
Step 4: Answer the agent's questions
The agent asks its questions in one message, in plain words, with a suggested answer for each. Ours asked thirteen. Three need a decision from you:
| Question | Why it matters | Example answer |
|---|---|---|
| Cookies and consent | The tracker sets one first-party cookie to recognise a returning visitor | Show a consent banner; set the cookie only after Accept |
| Who sees the reports | Visits and leads are tied to visitor IDs, which count as personal data | Only the owner for now |
| May it change the website | Nothing is collected until you publish the change | Yes |
For the rest, the suggestions are usually right: your time zone, which form or purchase counts as a conversion and how often, credit over 90 days with last click shown first, your currency, and Google Ads and Meta on sample data until you connect them. You can change any of them, for example how long raw visits are kept, or refreshing the reports every hour for a smaller site. A whole reply can be this short:
1. a) Add the consent banner. Keep raw data for 14 months.
2. Only me for now.
3. Yes, go ahead and change the site's code.
4. Just our website.
5. UK time. Our ad accounts are on UK time too.
6. Only the wholesale request.
7. Every form counts once is fine.
8. Fine.
9. Google Ads and Meta, one account each, auto-tagging is on, no agency. Sample data until I connect them is fine.
10. Defaults are fine.
11. Pounds only.
12. No other tool, nothing to compare.
13. Under 5,000 page views a month, so refresh every hour.
The agent never asks for passwords or keys in the chat. Ad accounts are connected in SegmentStream, by you.
Step 5: Approve the plan
Before writing code, the agent wrote a one-page plan and waited. In short:
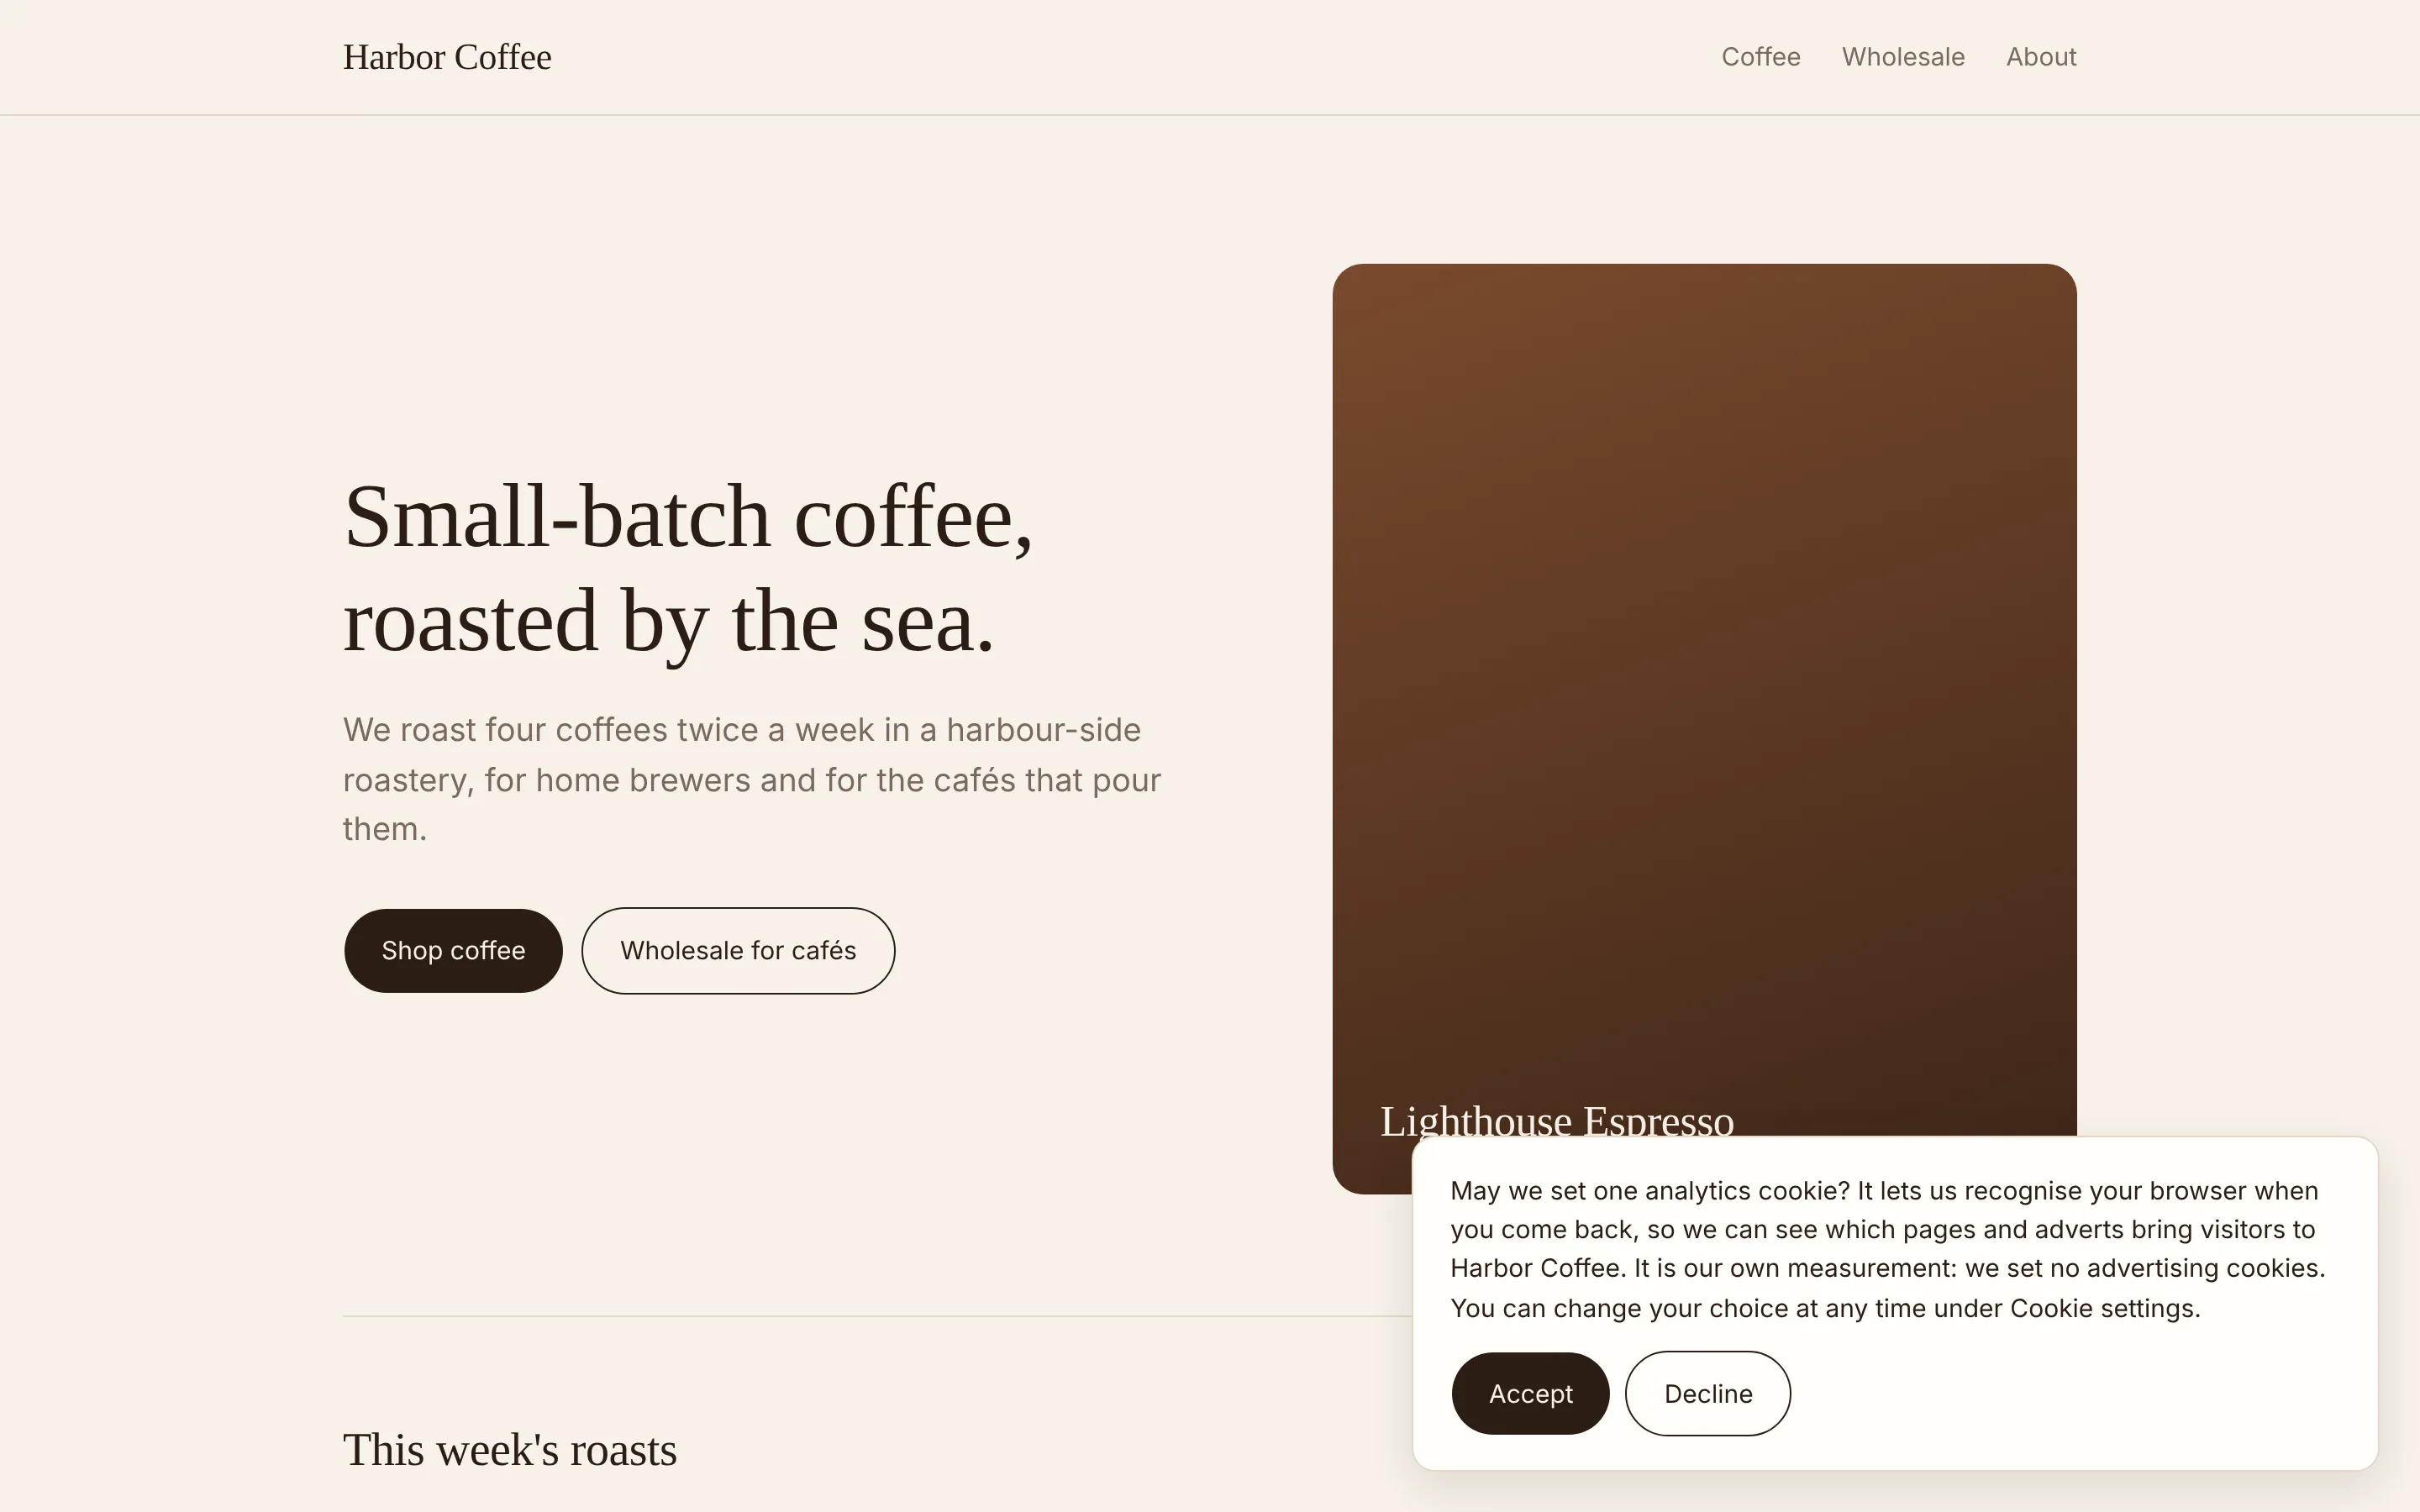
- In your website's code: a cookie banner with Accept and Decline; a page view for every page; each lead recorded on the server when the form is accepted, with the email scrambled so the address never reaches analytics.
- In the workspace: an event stream that accepts data only from your site; pipelines for sessions, channels (paid search, paid social, organic search, email, referral, direct and AI assistants), leads, first-click and last-click attribution, ad costs matched to the visits they paid for, and a report of the AI assistants and crawlers that read your site.
- Reports in the workspace app: an overview with a daily trend and a channel table, campaigns, each lead with the visits behind it, AI agents and crawlers, and data quality.
- Left out, in our case: revenue and return on ad spend, because our leads had no price on them, and sending conversions back to Google or Meta.
It also said what needs a person: someone who advises you on privacy should read the banner's wording and the 14-month retention. We approved:
Go ahead. Build it, run the checks, and show me what you'll deploy before you deploy anything.
Step 6: Let the agent build and test it
In our walkthrough the agent worked for about an hour on its own. It wrote the event stream, the pipelines, the reports and the workspace assistant's knowledge of the new numbers in the workspace's repository, and the banner, tracker and form event in the website's repository. Every rule in the blueprint became an automatic test, 61 in all, and the blueprint's worked example day came out exactly as expected. It also checked that the website never ships the stream's key to the browser, and that an email leaves the site only scrambled.
Check before you go on
- The agent reports every check passing and names any rule it could not test.
- Both repositories have the work committed; nothing is deployed or pushed yet.
BLUEPRINTS.mdin the workspace lists every place the build differs from the blueprint, with the reason.
Step 7: Deploy the workspace
The agent listed what would go live and waited for a yes. Then it deployed:
$ segmentstream deploy
Ready: https://acme-analytics.segmentstream.app
Took 3m41s

Connections needing setup:
  google_ads  Authorization required
  meta_ads    Authorization required
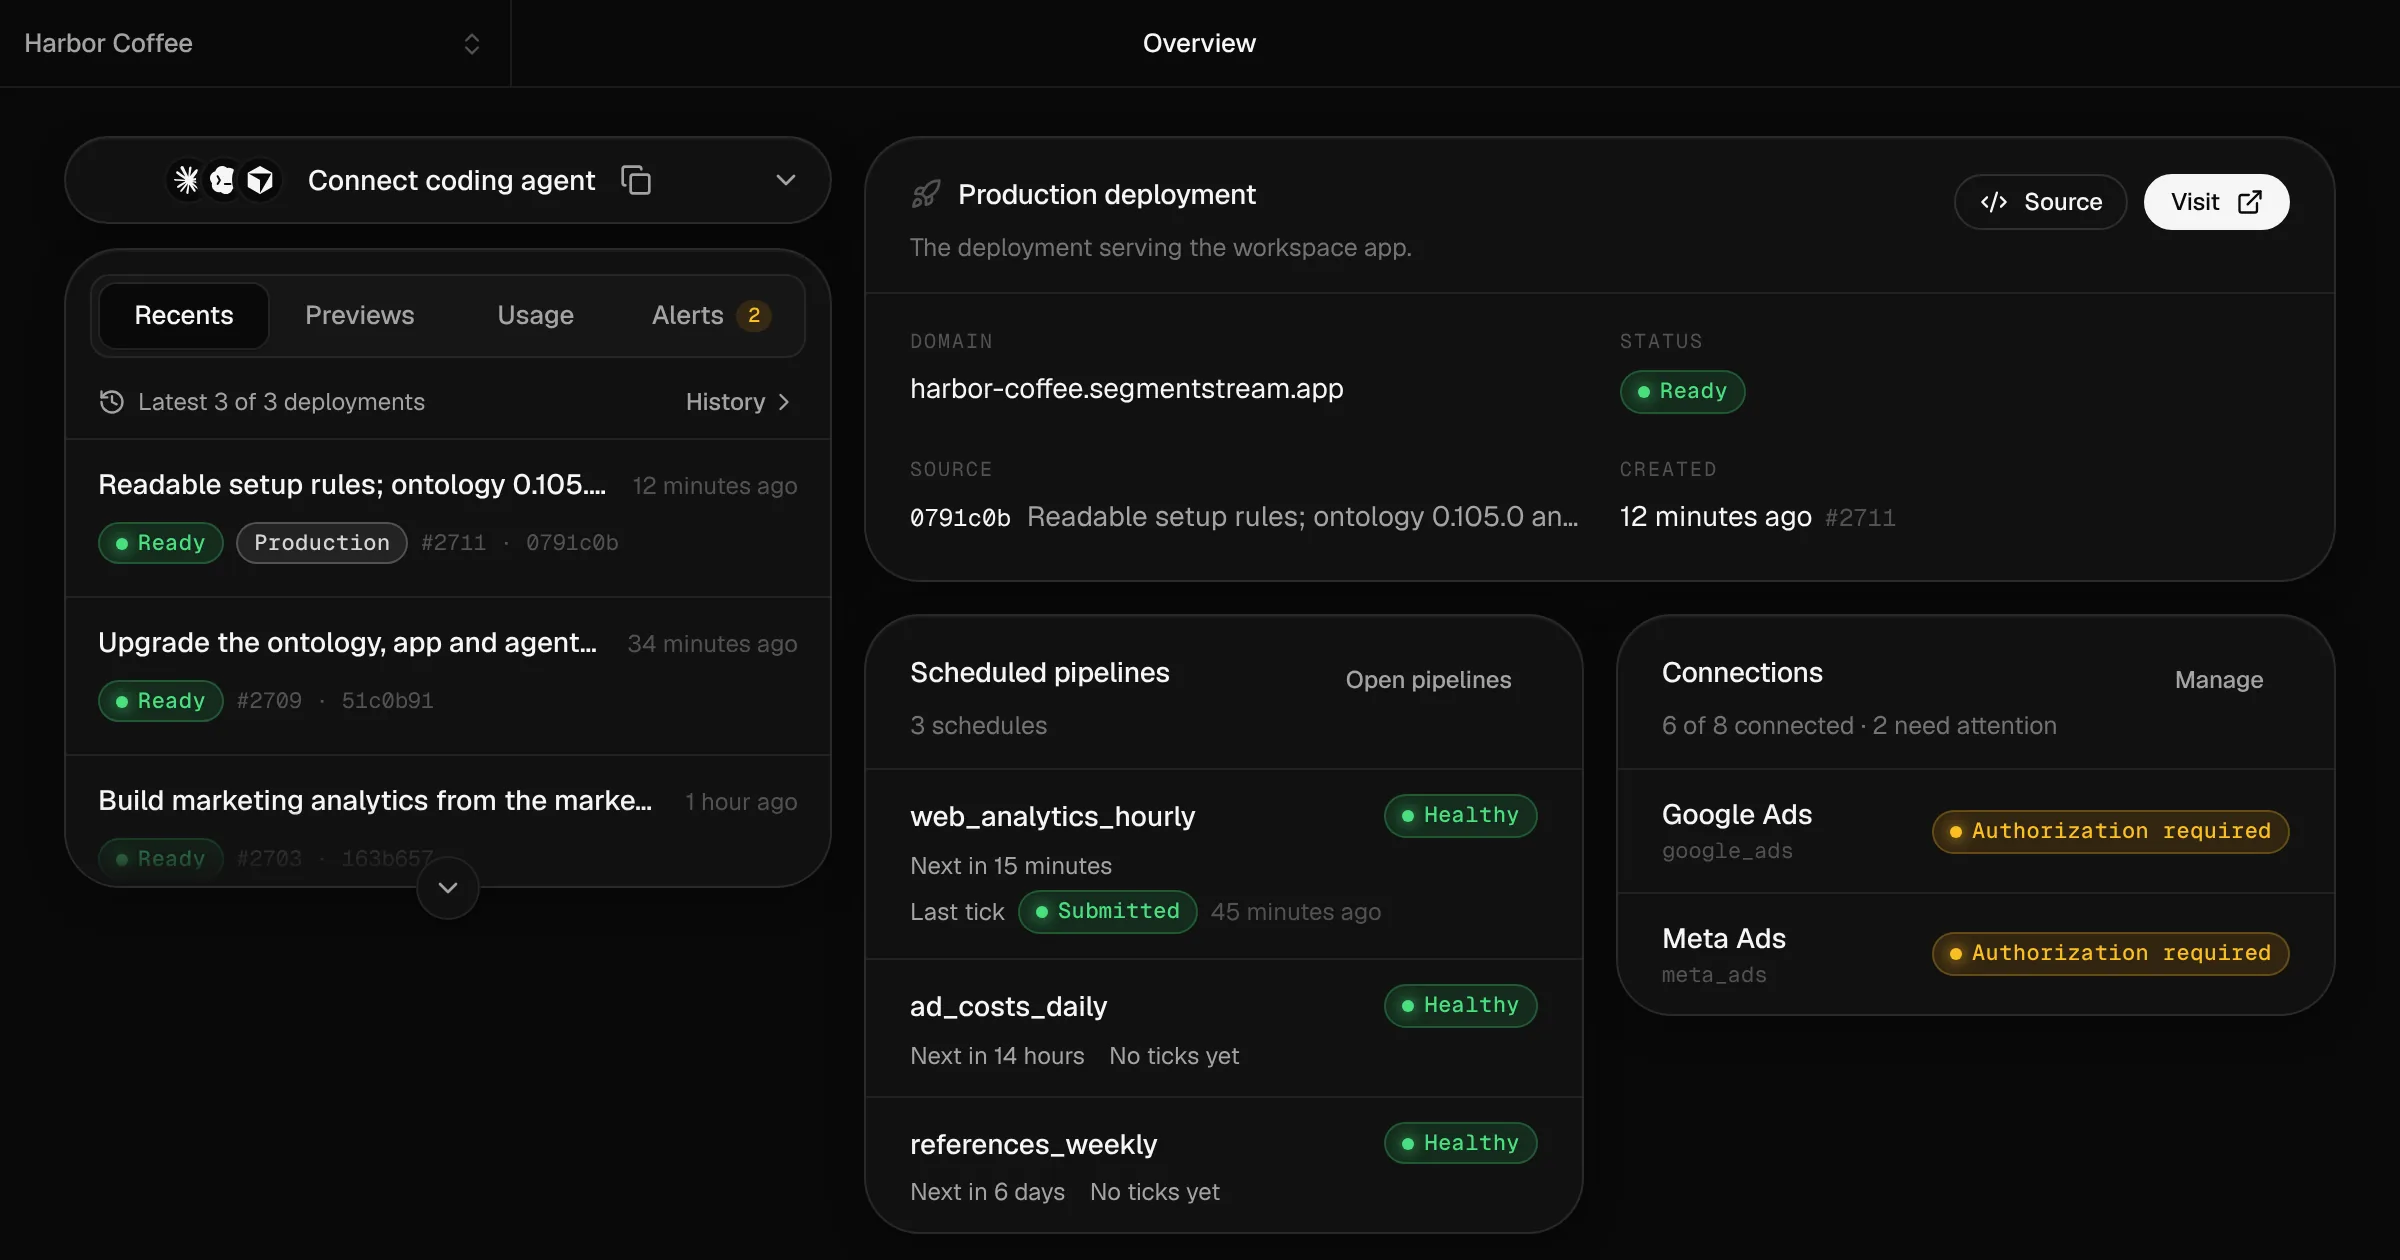
To check its work before real visitors arrive, the agent loaded 56 days of invented sample data and compared every report with its own tests. In SegmentStream Cloud, the workspace now shows the live app, the pipelines running on their schedules and the two connections that wait for you.
Check before you go on
- Overview shows the production deployment as Ready.
- Pipelines show the reports refreshing on the schedule you agreed.
- Connections show Google Ads and Meta as Authorization required: that step is yours.
Step 8: Put the tracker live on your website
The agent made its changes in your website's repository. Before you publish them, the site needs two settings from the workspace: the stream's address, and its write key for the events your site's server sends. The key comes from one CLI command, segmentstream events rotate-key web. In our walkthrough the agent asked us to run it ourselves, so the key never passed through the chat, and told us exactly where to paste both settings in Vercel. An agent that can reach your hosting can store them there for you. The key never goes into the code.
Then publish the site the way you always do. The banner appears, and every visit is sent to your workspace as it happens.
Ask the agent to confirm visits are arriving. It checks the stream with the CLI, and SegmentStream Cloud shows the same under Events, with how many arrive each day:
$ segmentstream events get web
web: active
Authentication: origin, write_key
Batching: enabled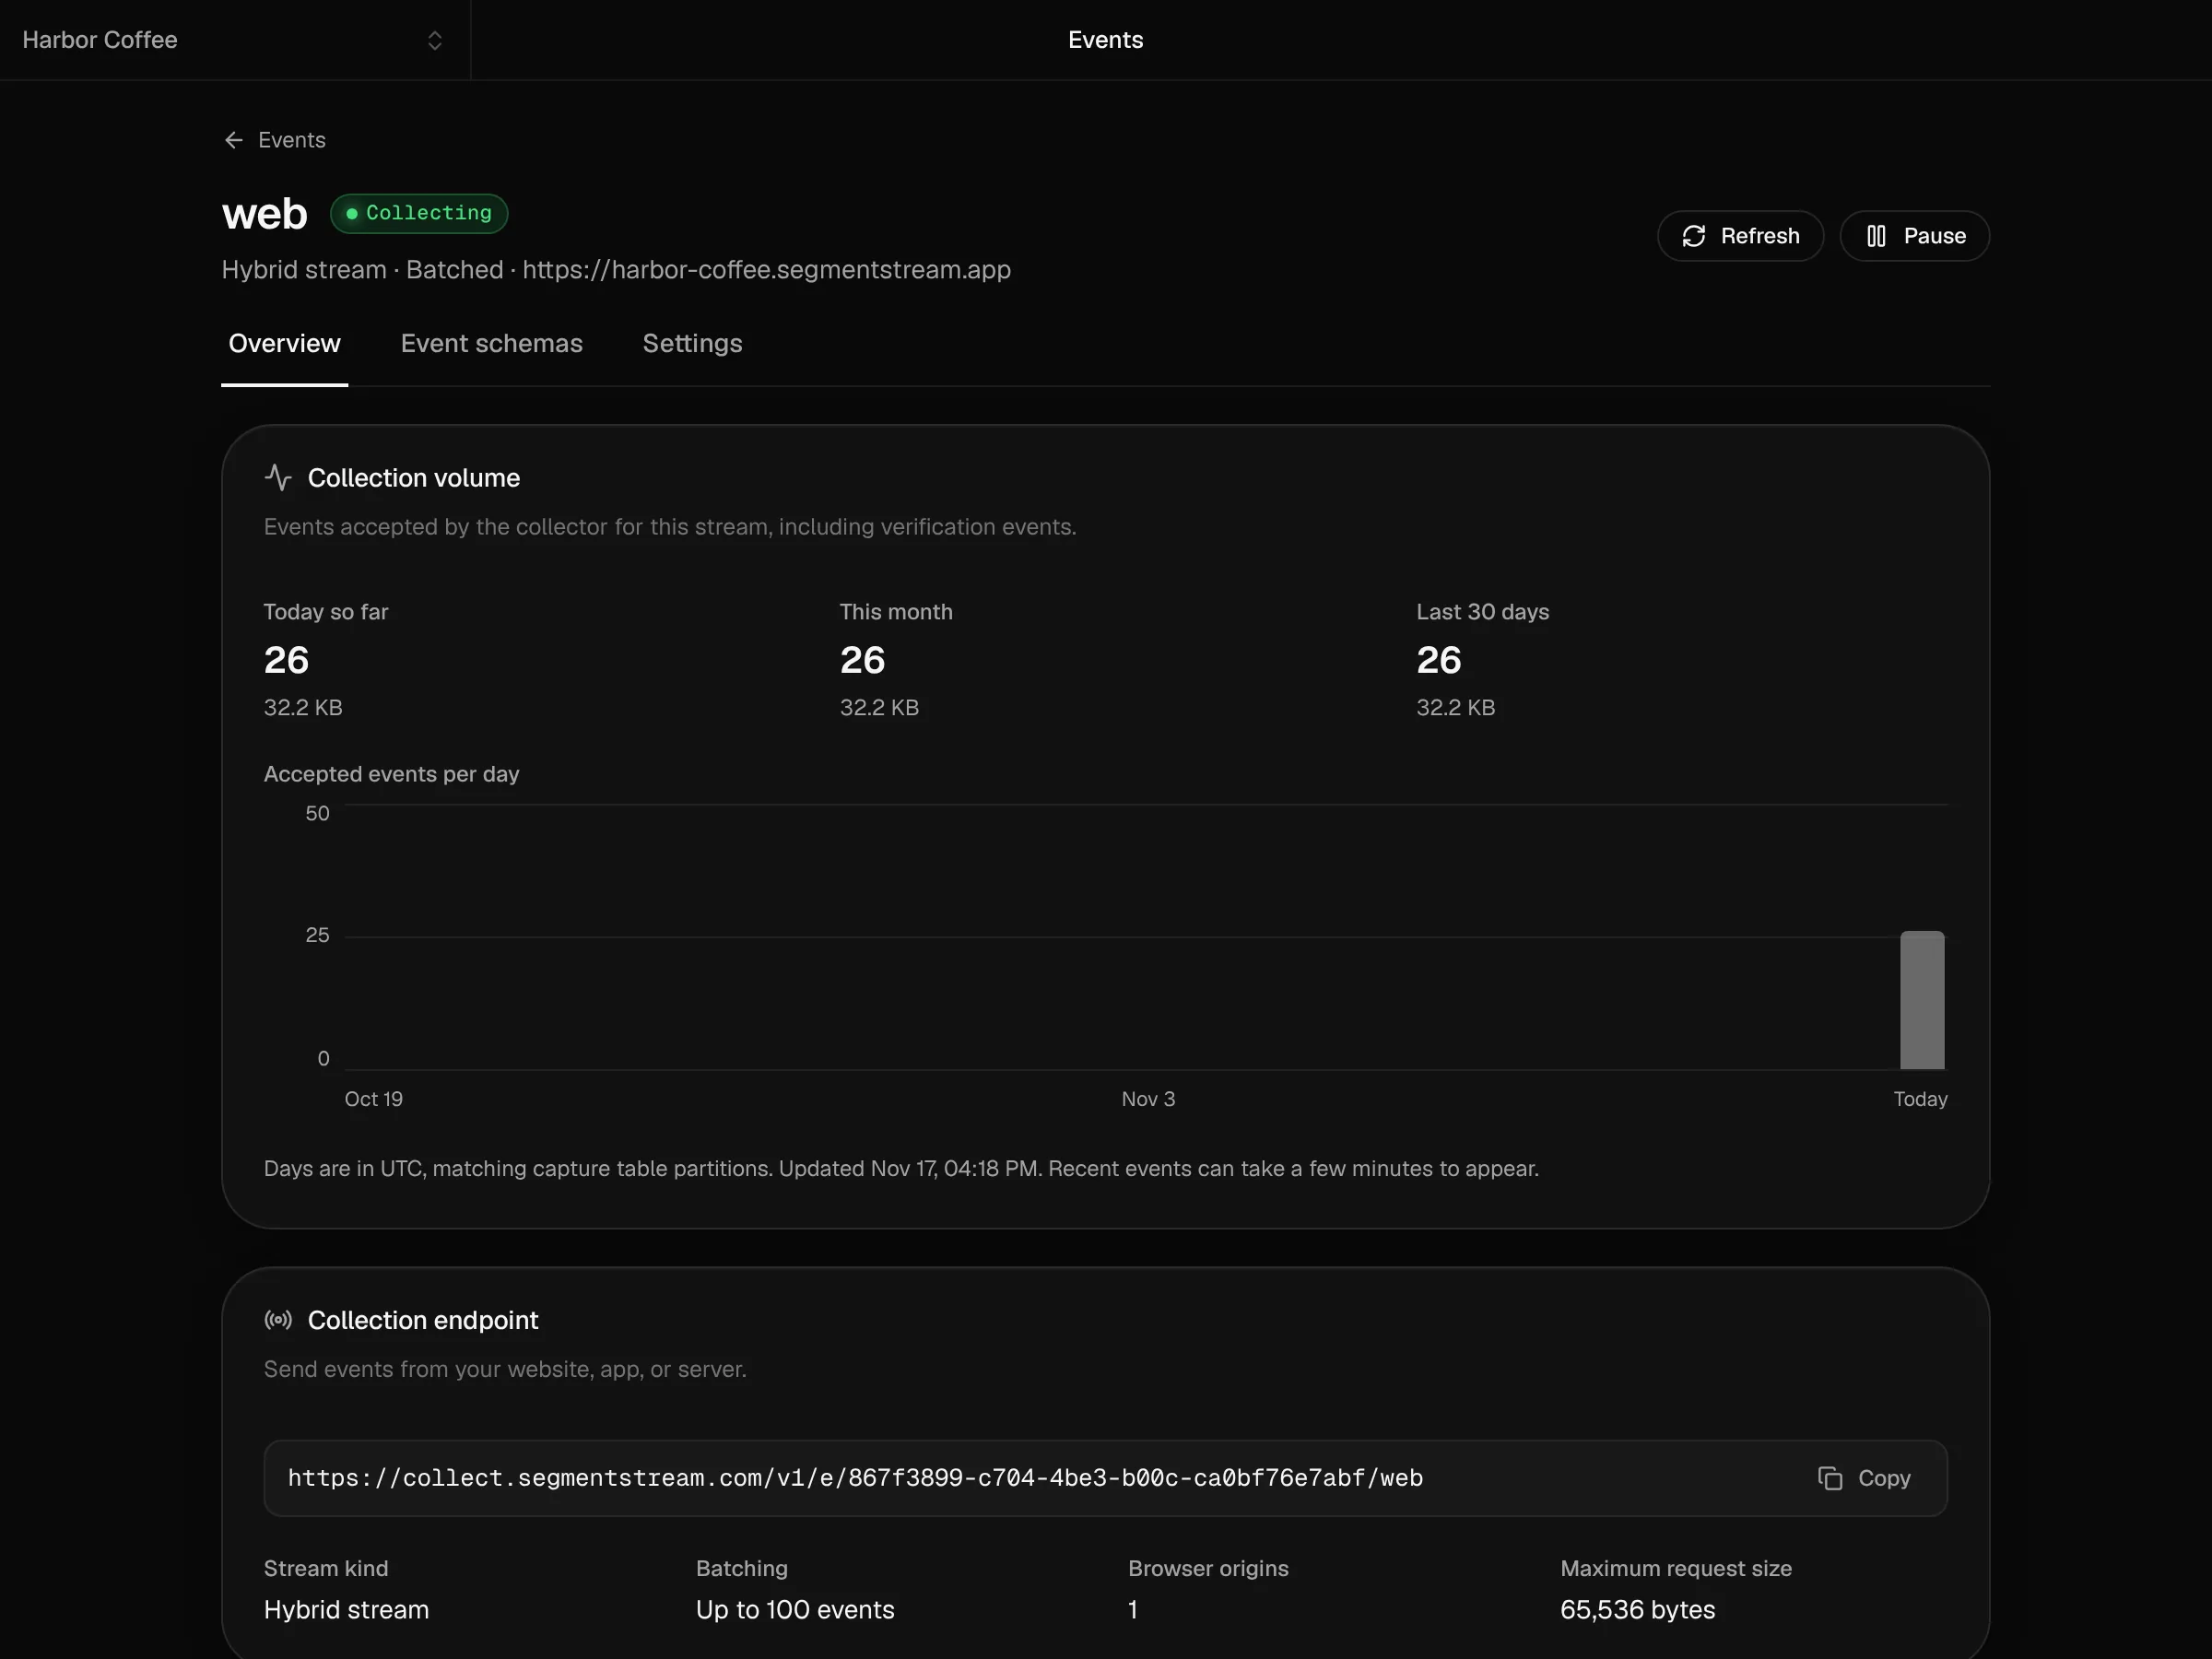
Check before you go on
- Open your site, accept the banner and look at two or three pages: Events shows them within a few minutes.
- Send a test through your form with an invented email and ask the agent whether the request arrived.
- When real visits look right, tell the agent to switch the reports from sample data to your visitors.
Step 9: Watch the data reach your warehouse
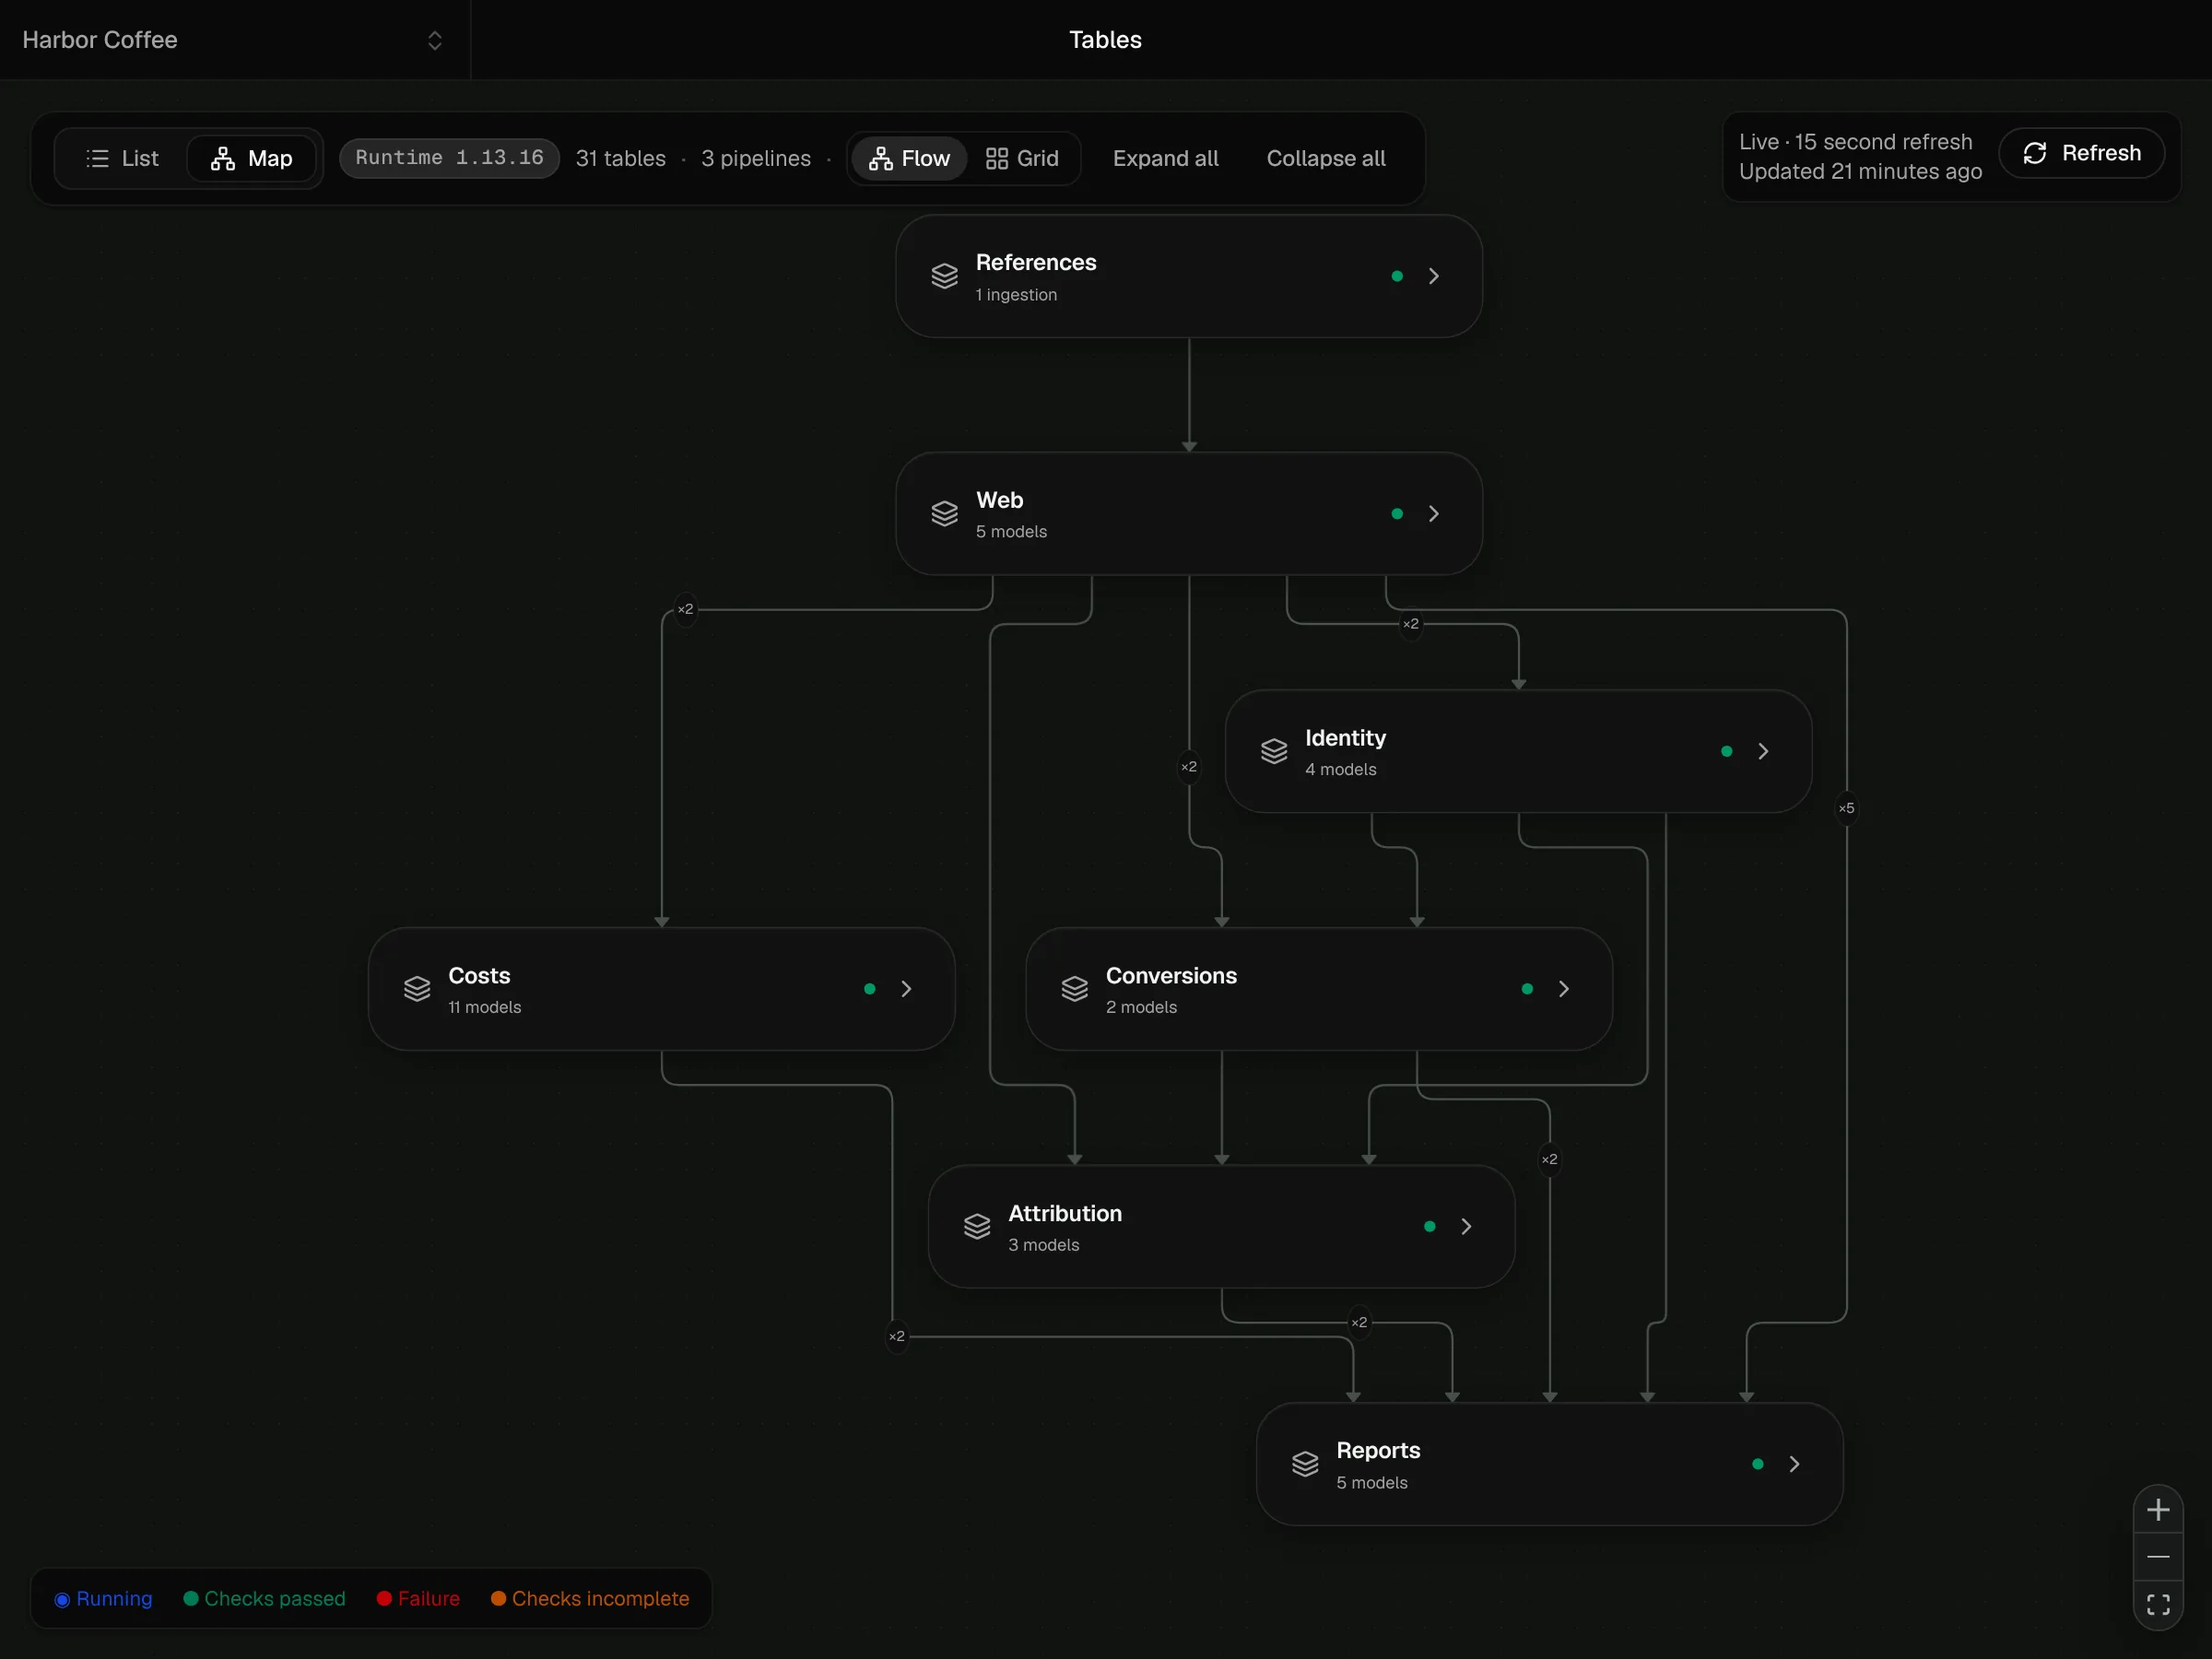
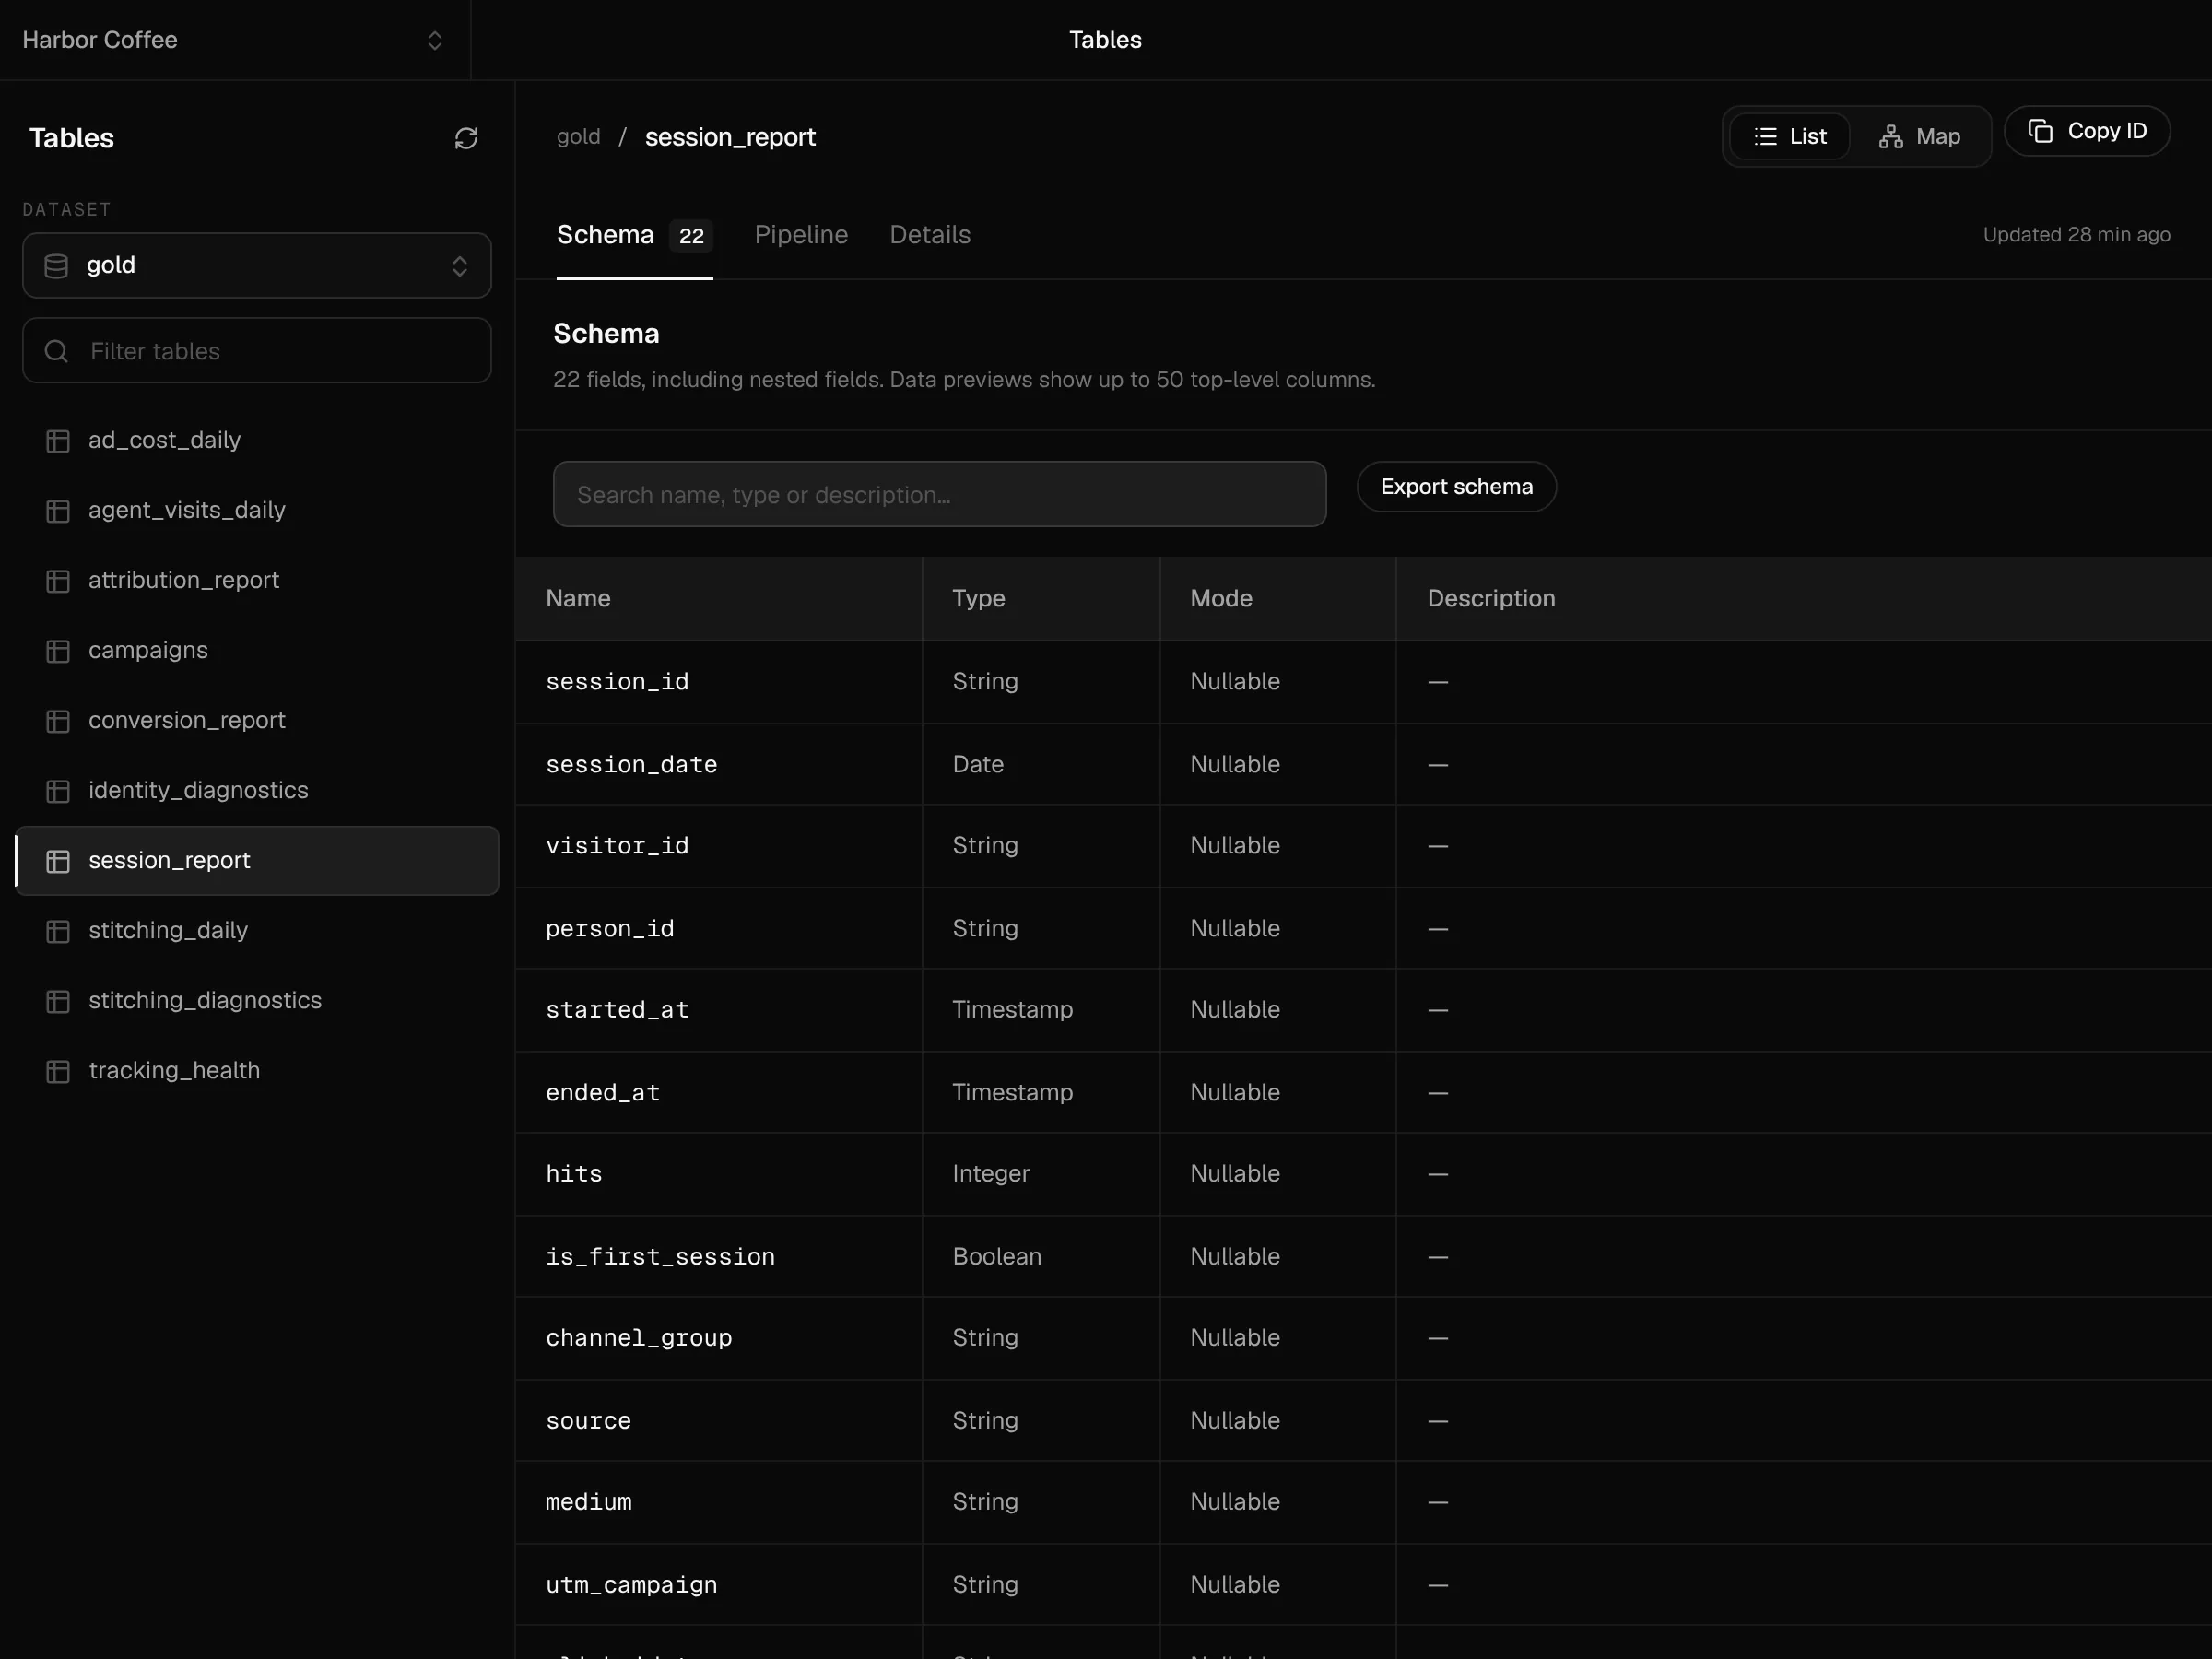
Every visit lands in your workspace's warehouse as a raw event, and the pipelines turn those rows into sessions, people, leads, costs and attribution. The table map in SegmentStream Cloud shows the whole chain, from the events your site sends and the public crawler lists to the report tables, with the state of each step.
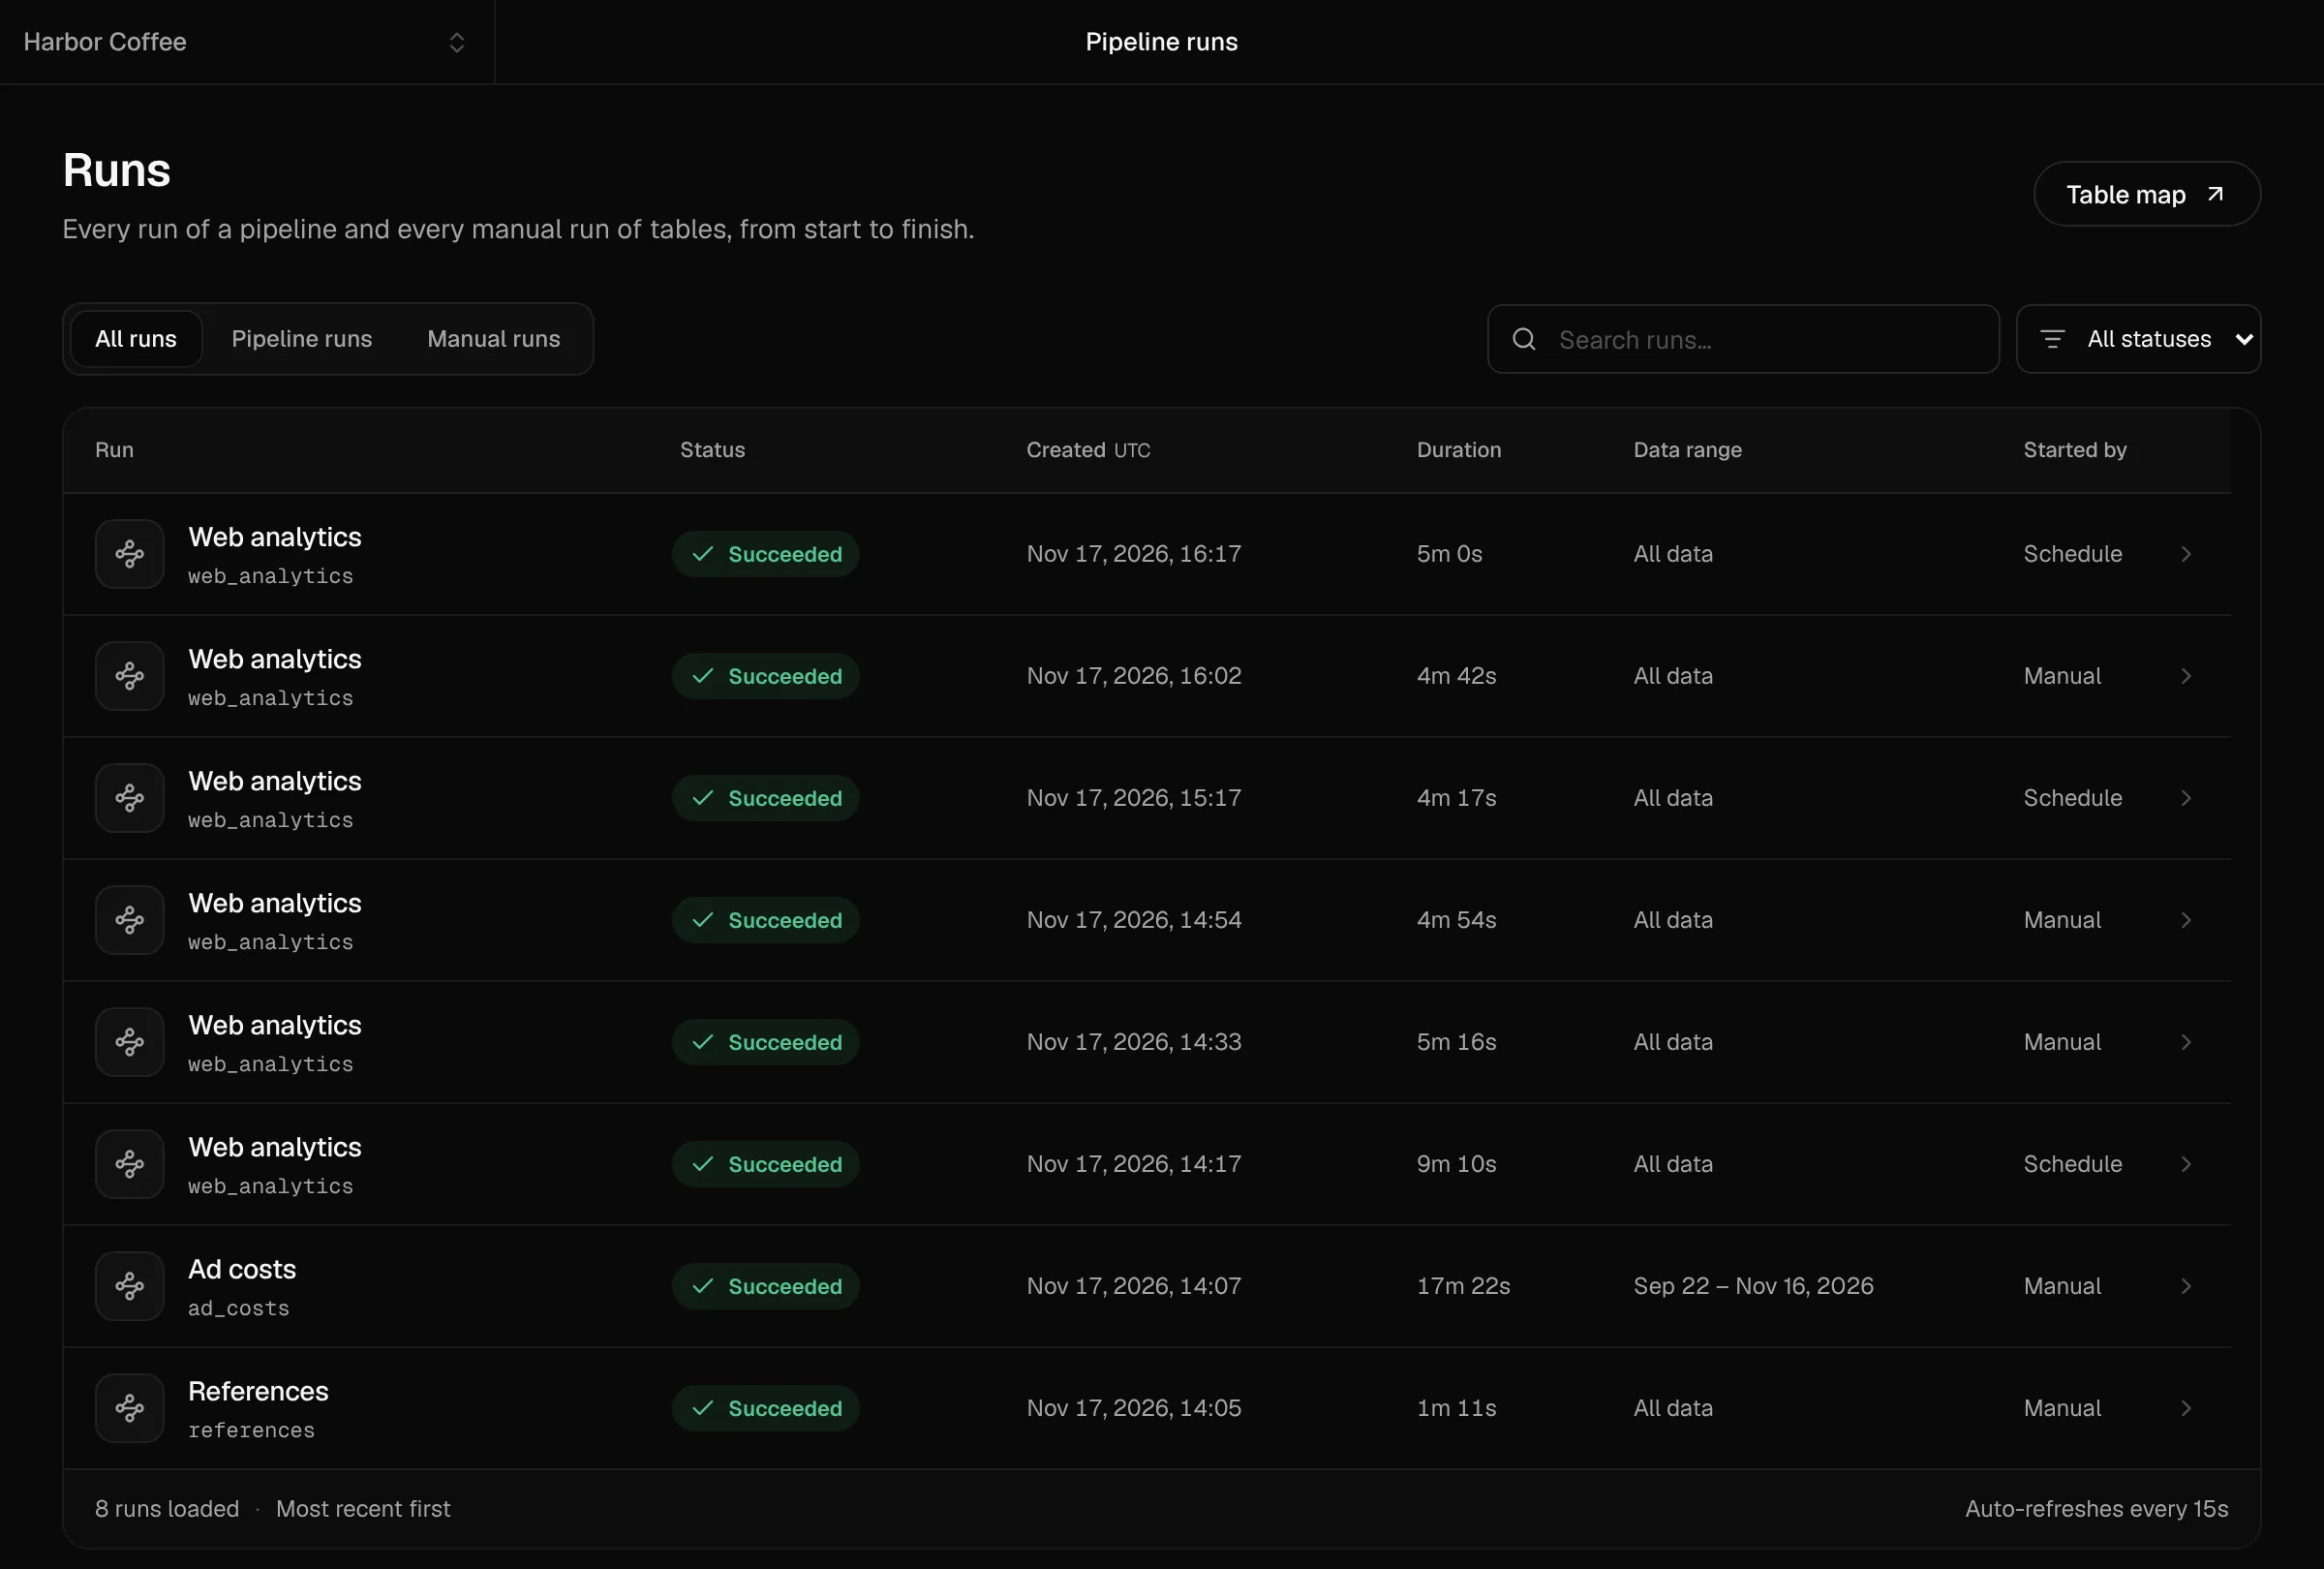
Runs shows each refresh: the hourly rebuild you asked for, the morning ad-cost load, and anything the agent started by hand, with how long it took.
Every table is there to open, with its columns and the pipeline that builds it. GA4's reports never show you this: every session as a row, with its source, campaign, pages and the person behind it, ready to join with anything else you keep.
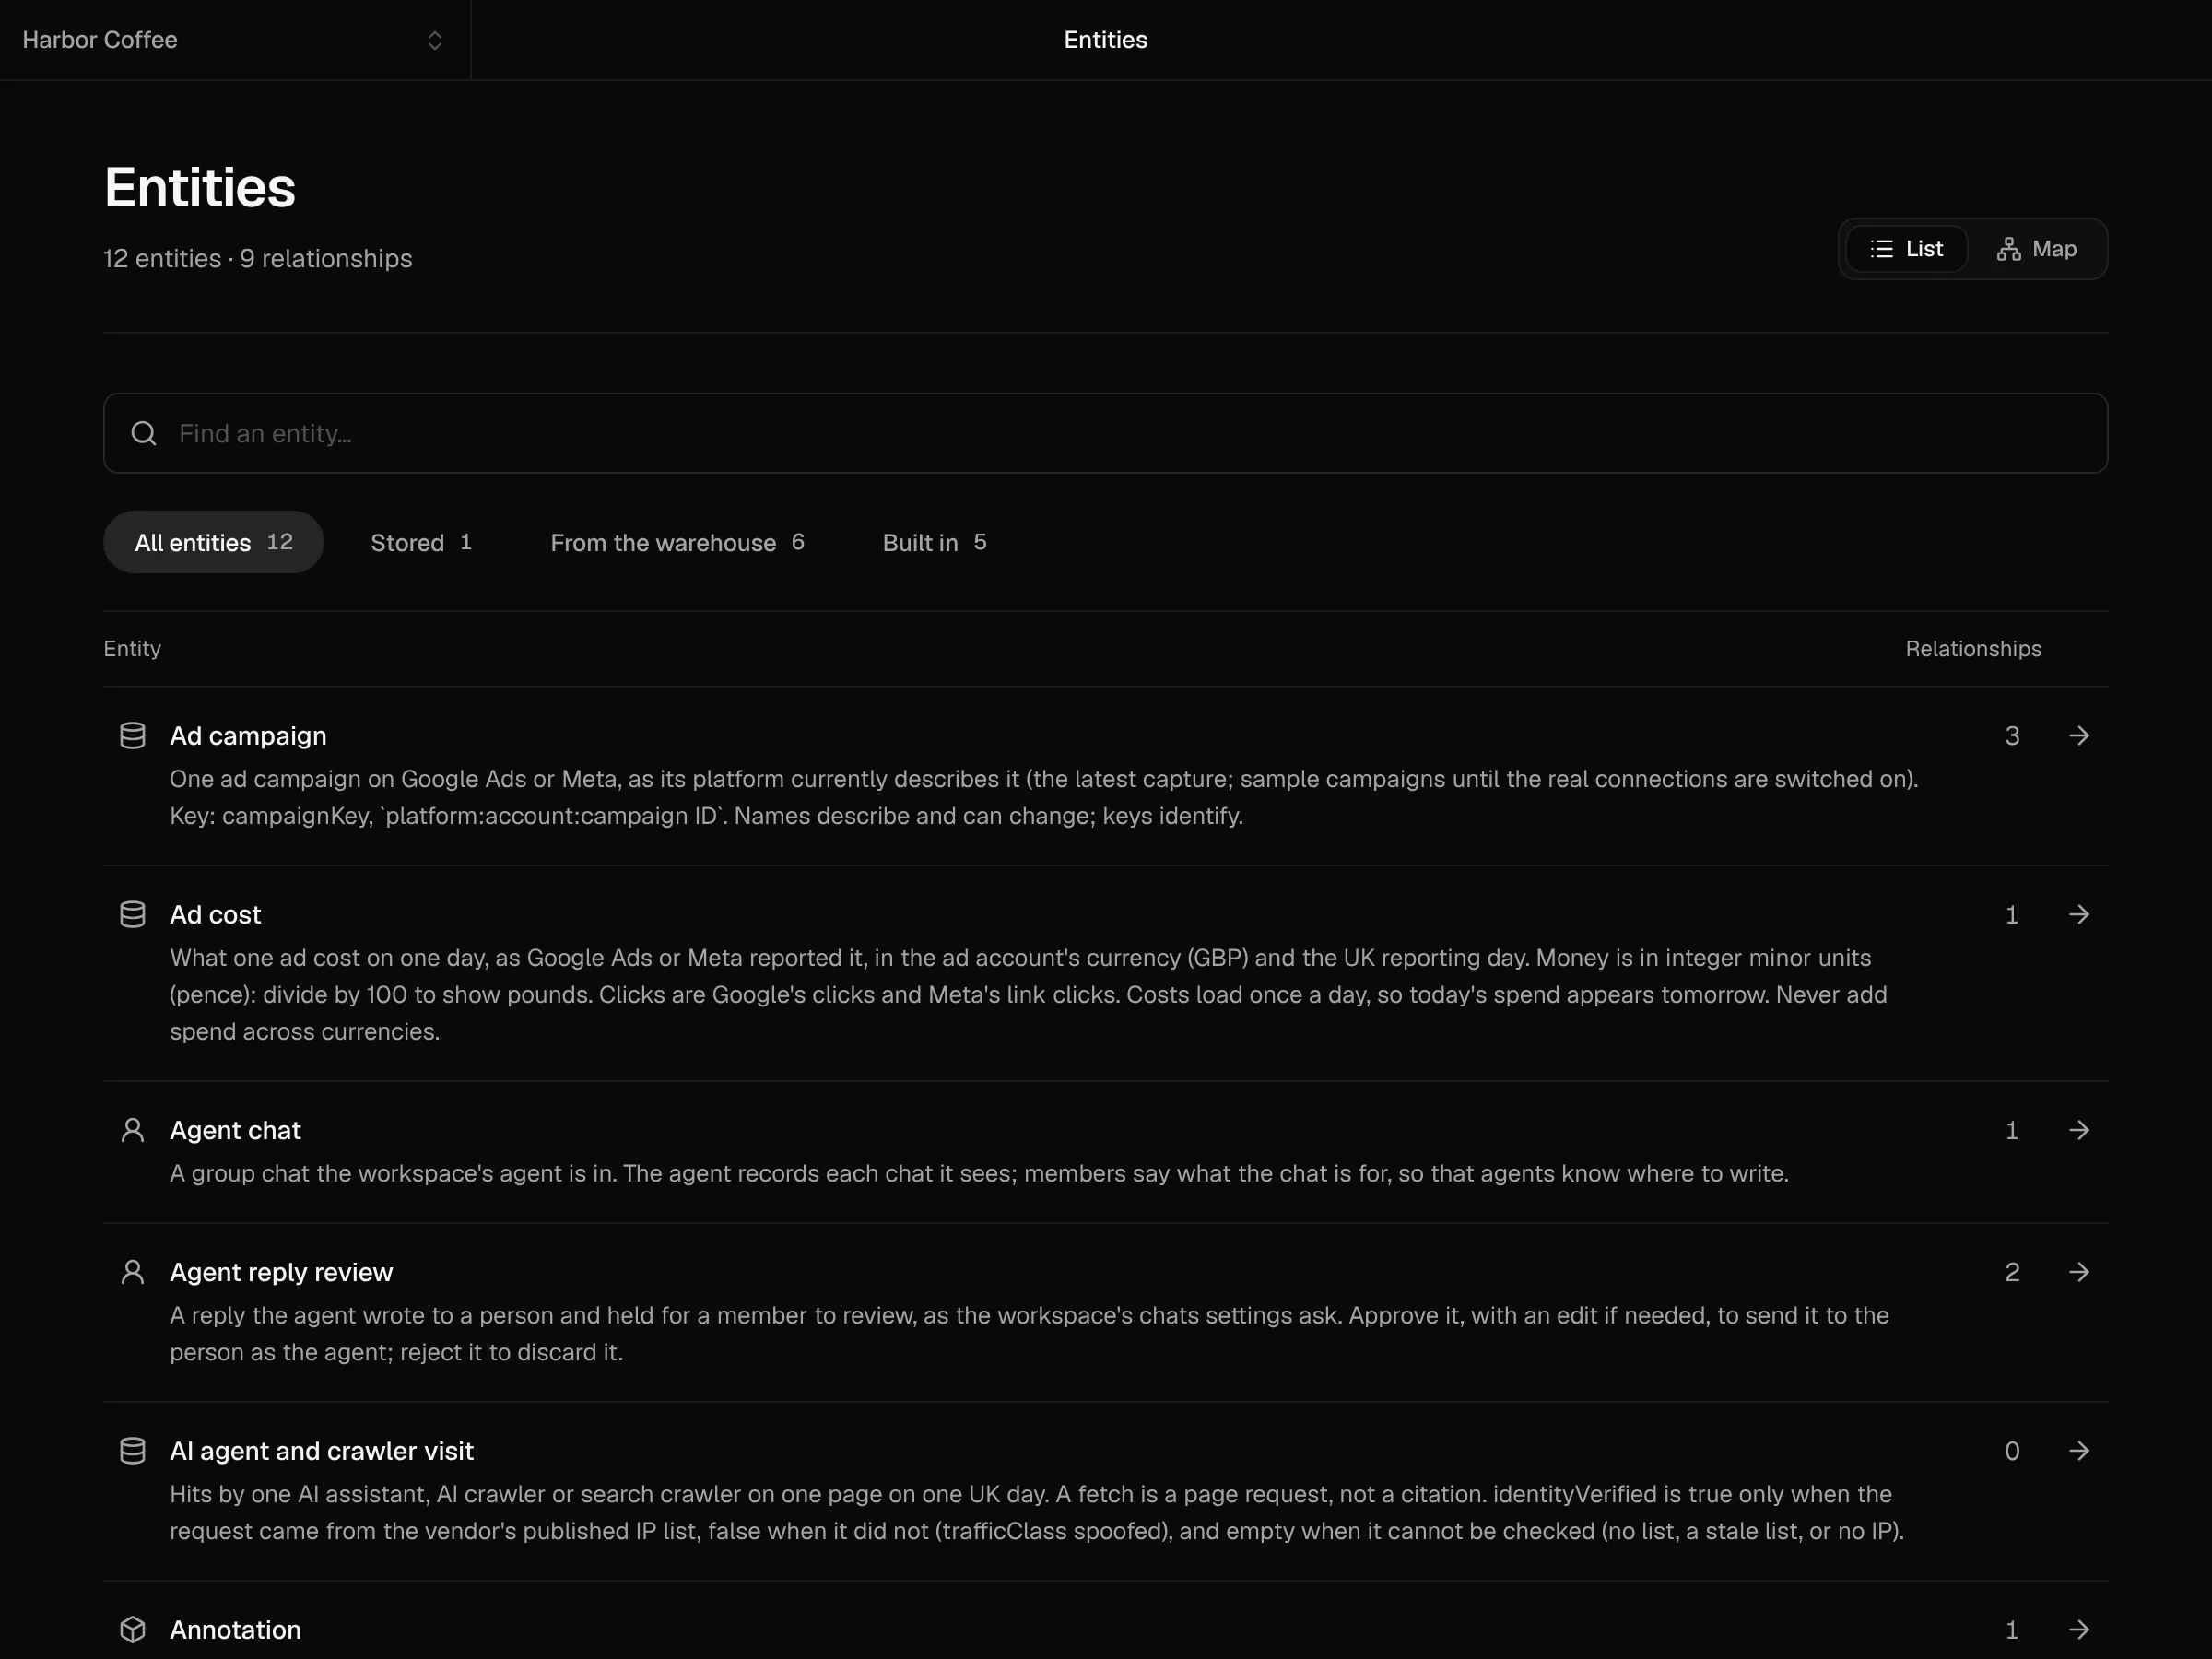
The numbers your team and your agents use are defined once, as entities with plain descriptions: an ad cost, a campaign, a visit by an AI agent. Reports, the workspace assistant and any agent you connect over MCP read the same definitions, so they give the same answer.
Check before you go on
- The table map shows a green dot on every step.
- Runs show the hourly refresh succeeding.
- Ask your agent a question about your data, such as "How many sessions came from paid search yesterday?", and check that it names the numbers it used.
Step 10: Connect Google Ads and Meta
Ad spend comes from your ad accounts, and only you can connect them. In SegmentStream Cloud, open Connections and press Authorize next to each one, or let the agent open the same consent page for you:
$ segmentstream connection authorize google_ads --openYou sign in to the platform and allow read access. The tokens stay in SegmentStream, never in your code or the chat.
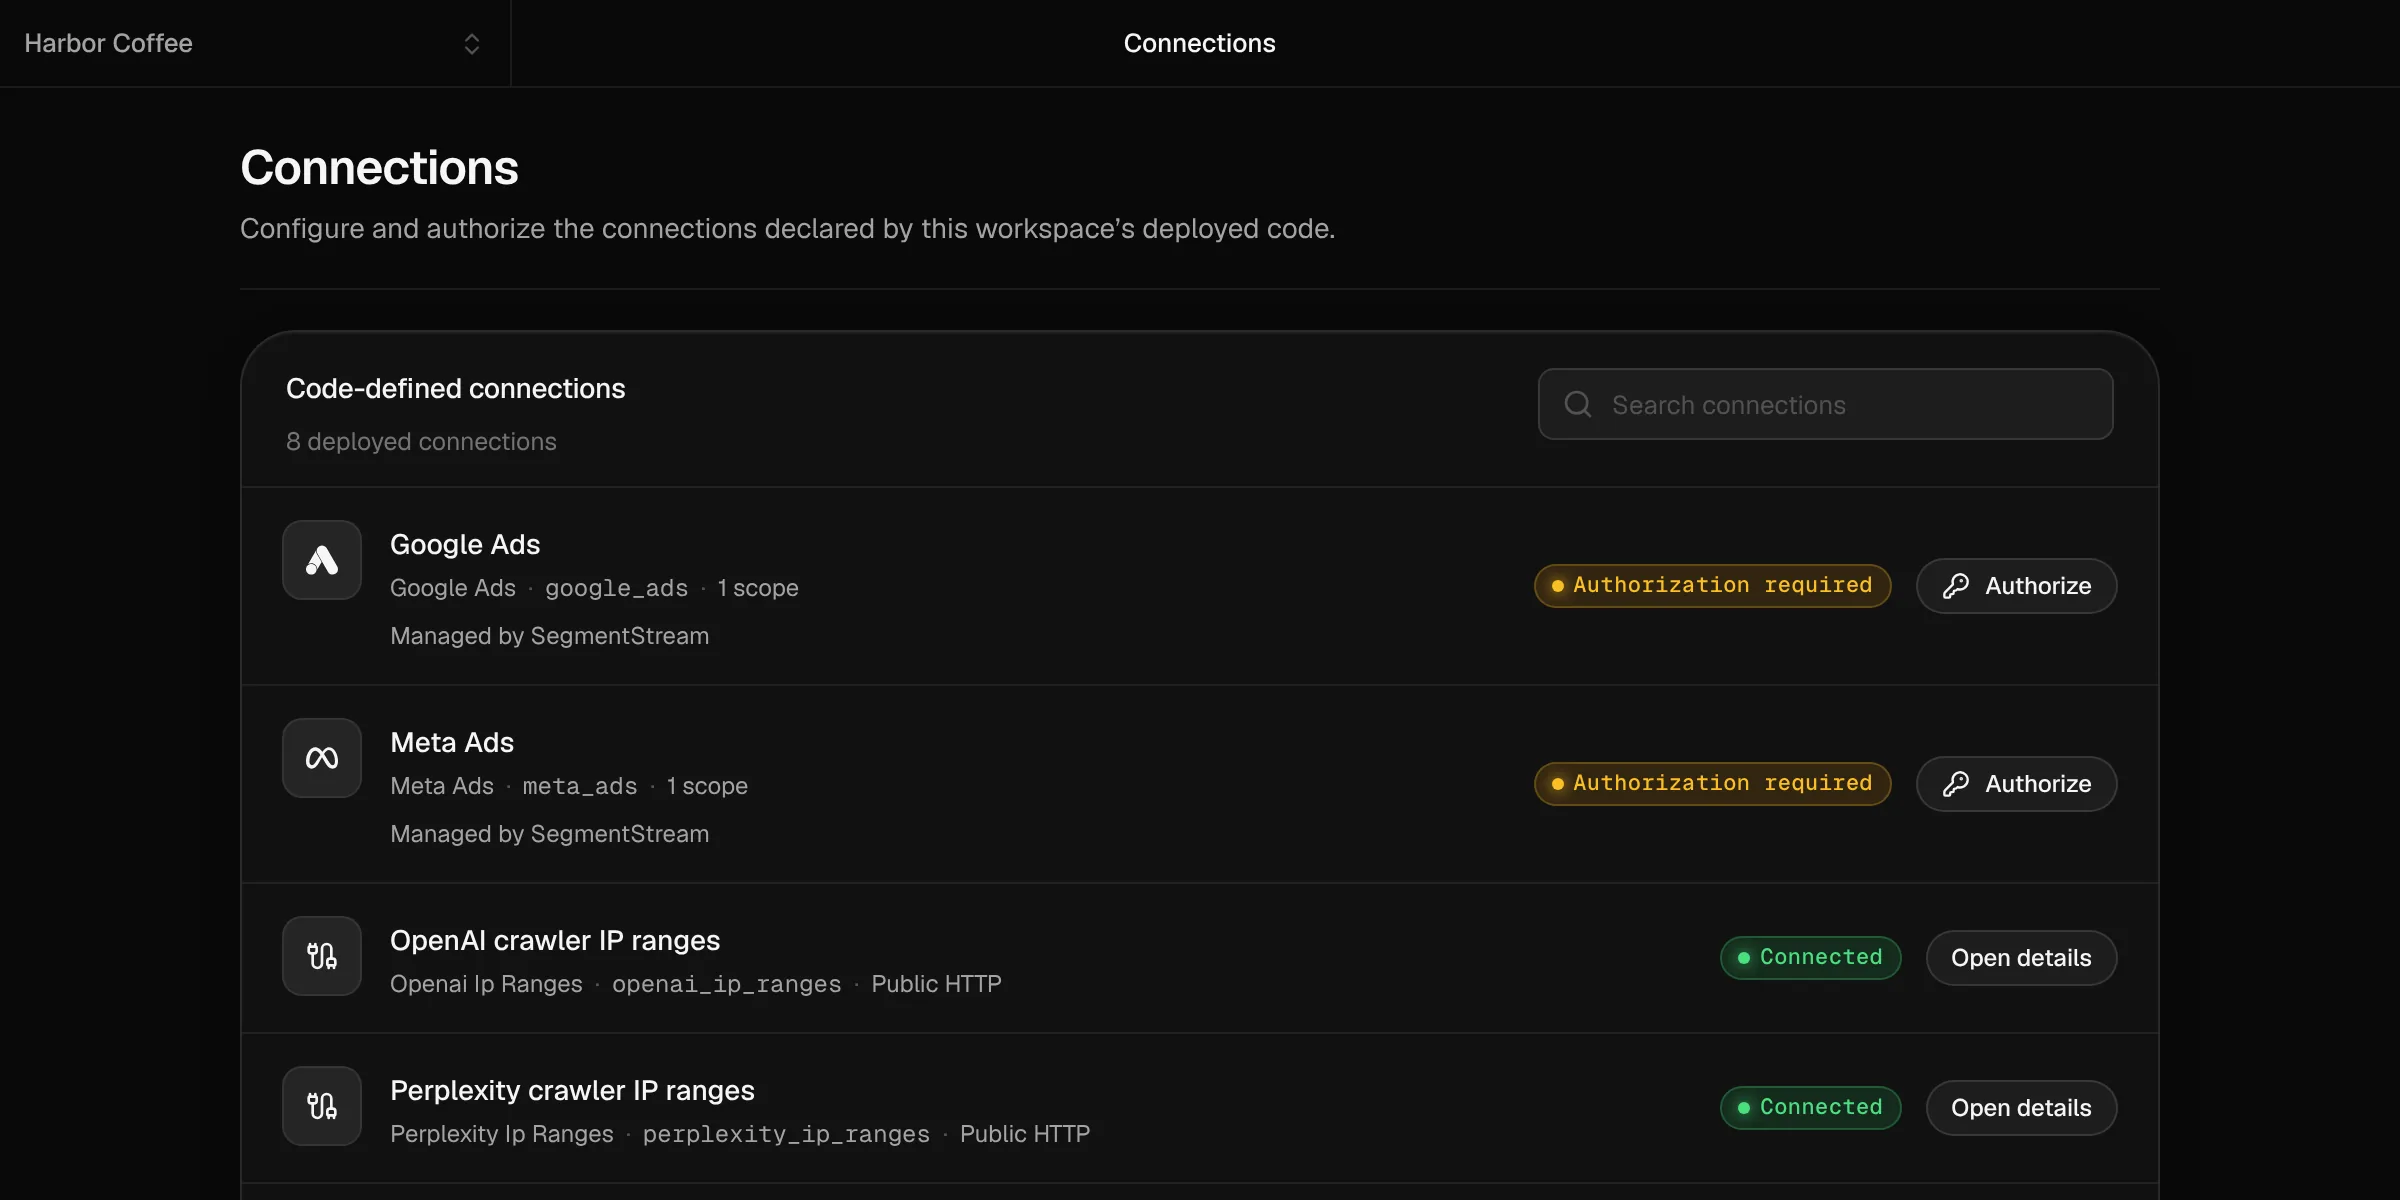
Costs load every morning, after the platforms settle the previous day. Until you connect them, the reports run on the agent's invented sample costs; switching to real ones is your call.
Step 11: Open your reports
The reports live in your workspace's app, behind sign-in, and only the people you choose can open them. Ask the agent to invite you and your team with the analytics role it created:
$ segmentstream ontology member invite you@yourcompany.com --role analytics_adminThe invitation arrives by email; open it and you are in. Then ask for the look you want, the same way you asked for everything else. Our agent redesigned the screens below from this prompt:
Make the reports look great: headline numbers with the change against the previous period, a daily trend chart, channels as a chart as well as a table, campaigns with their spend and leads, and each lead's path shown visually. Keep it readable on a laptop and a phone.
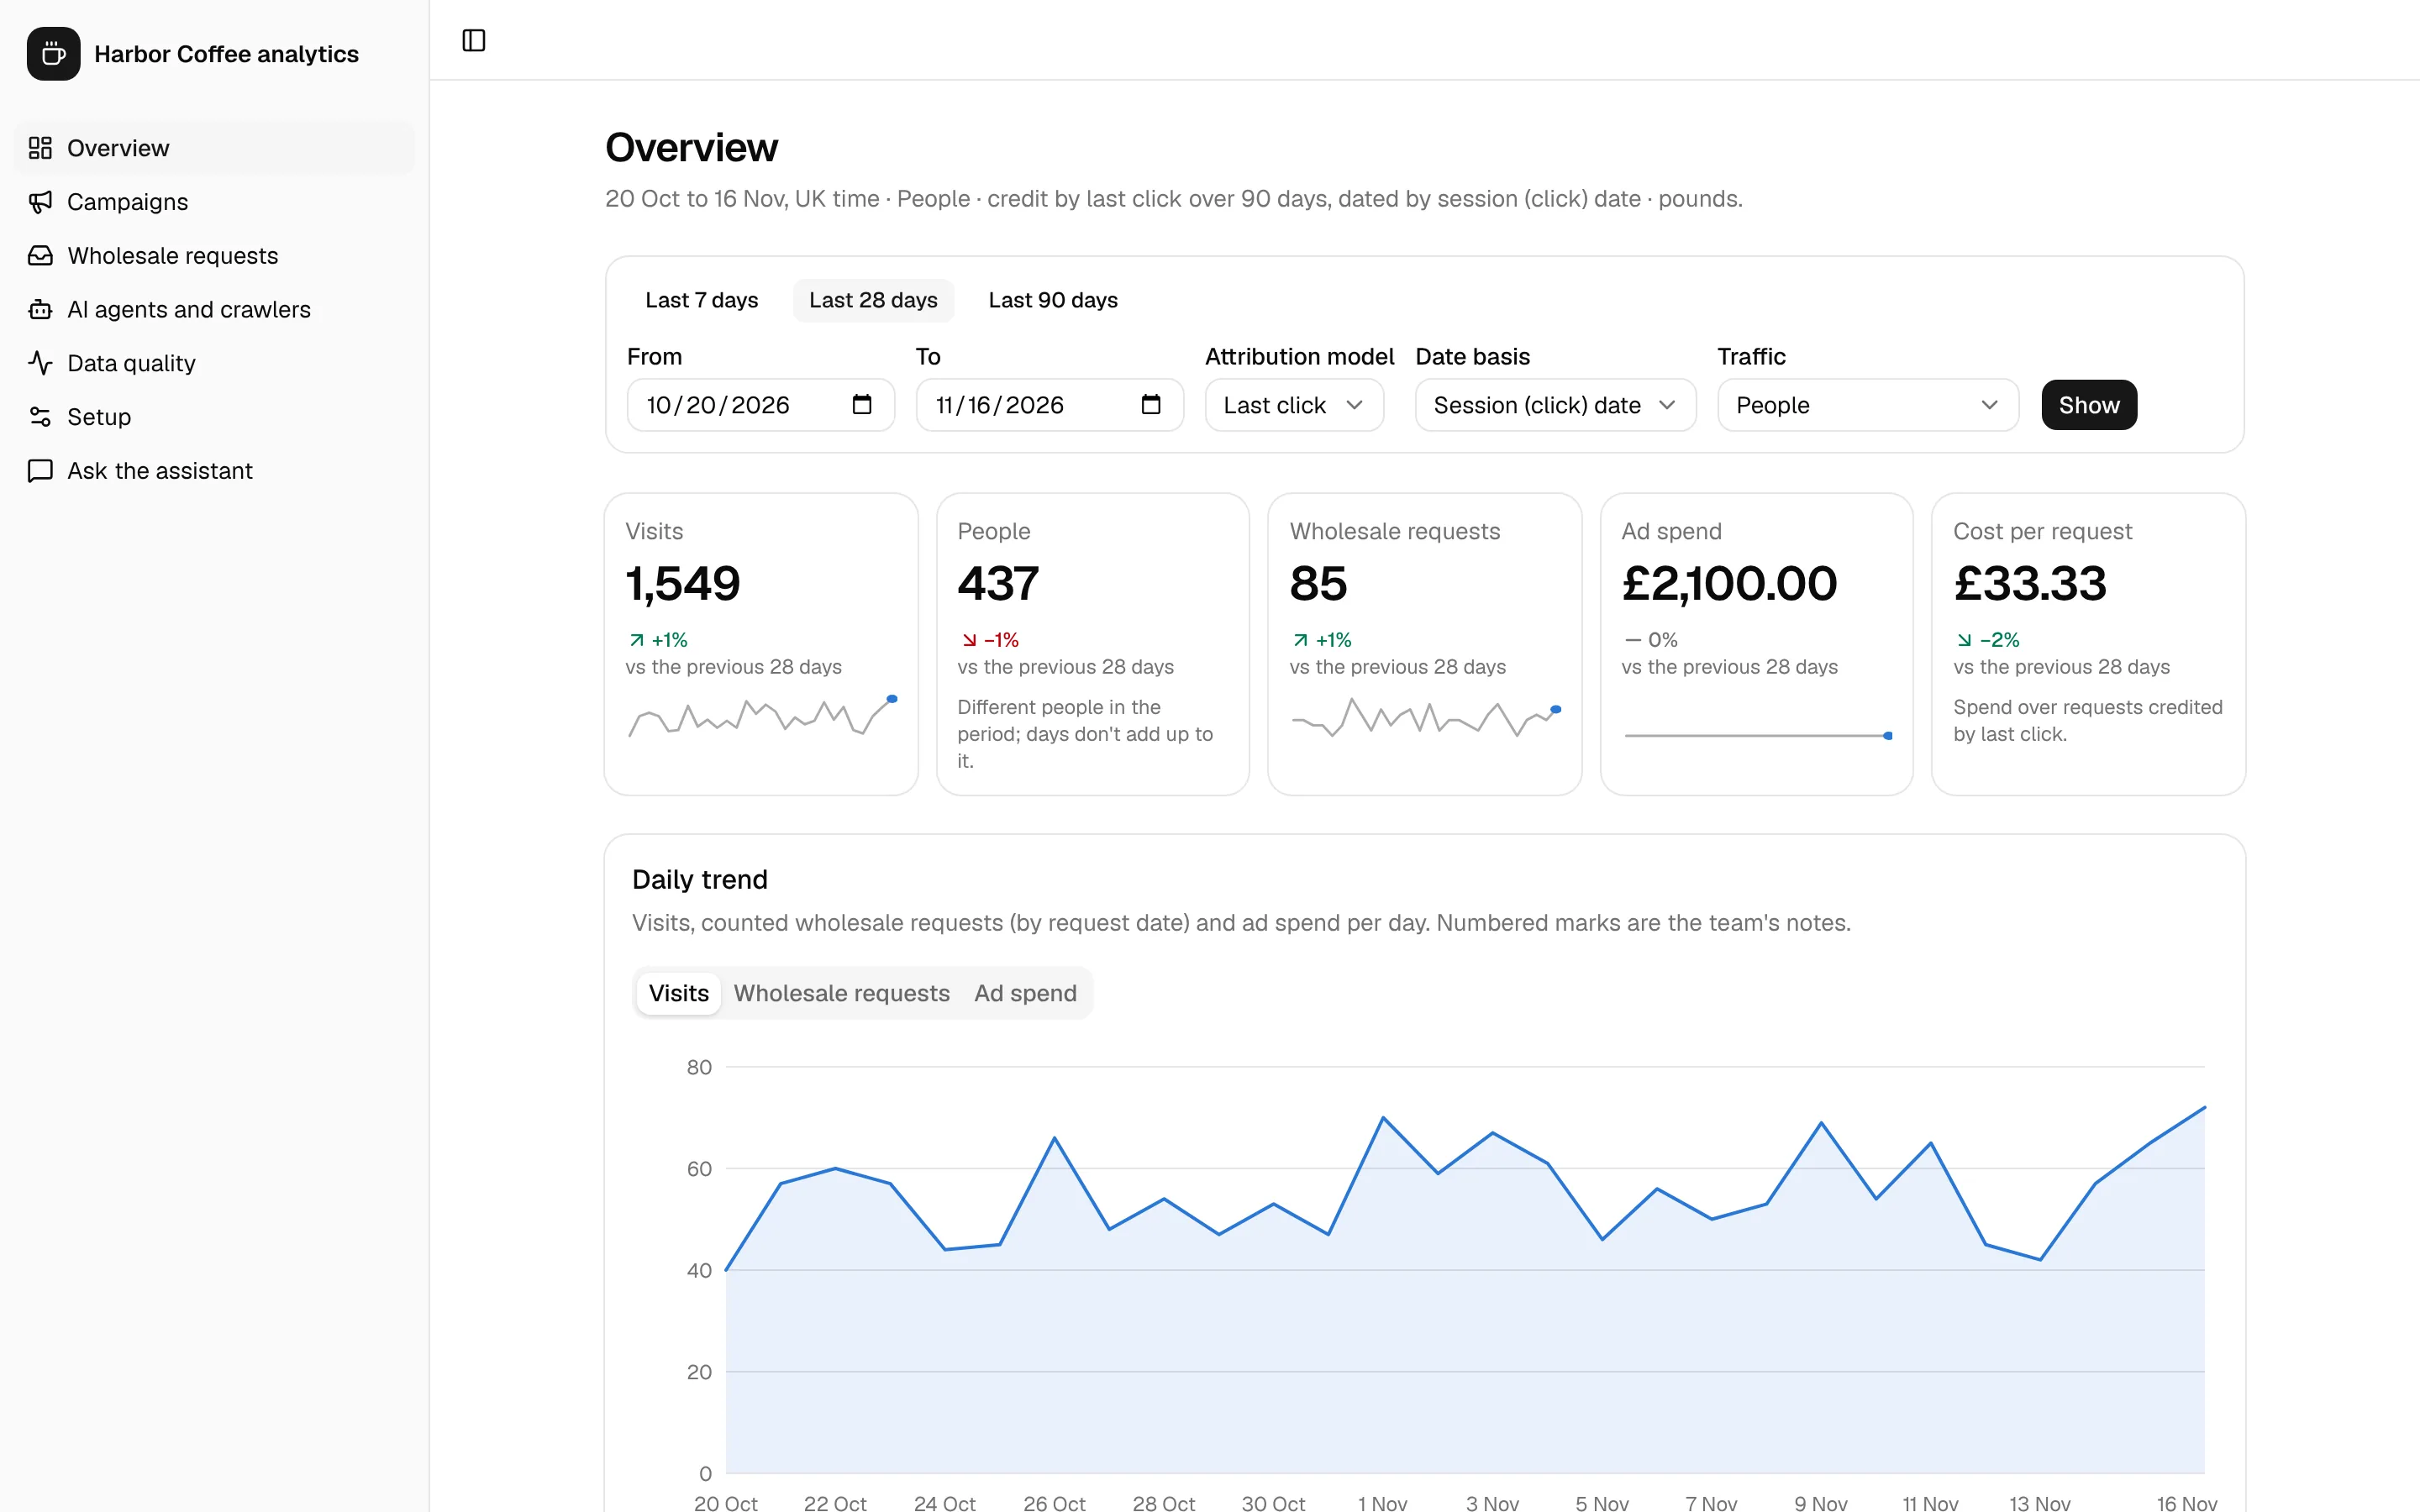
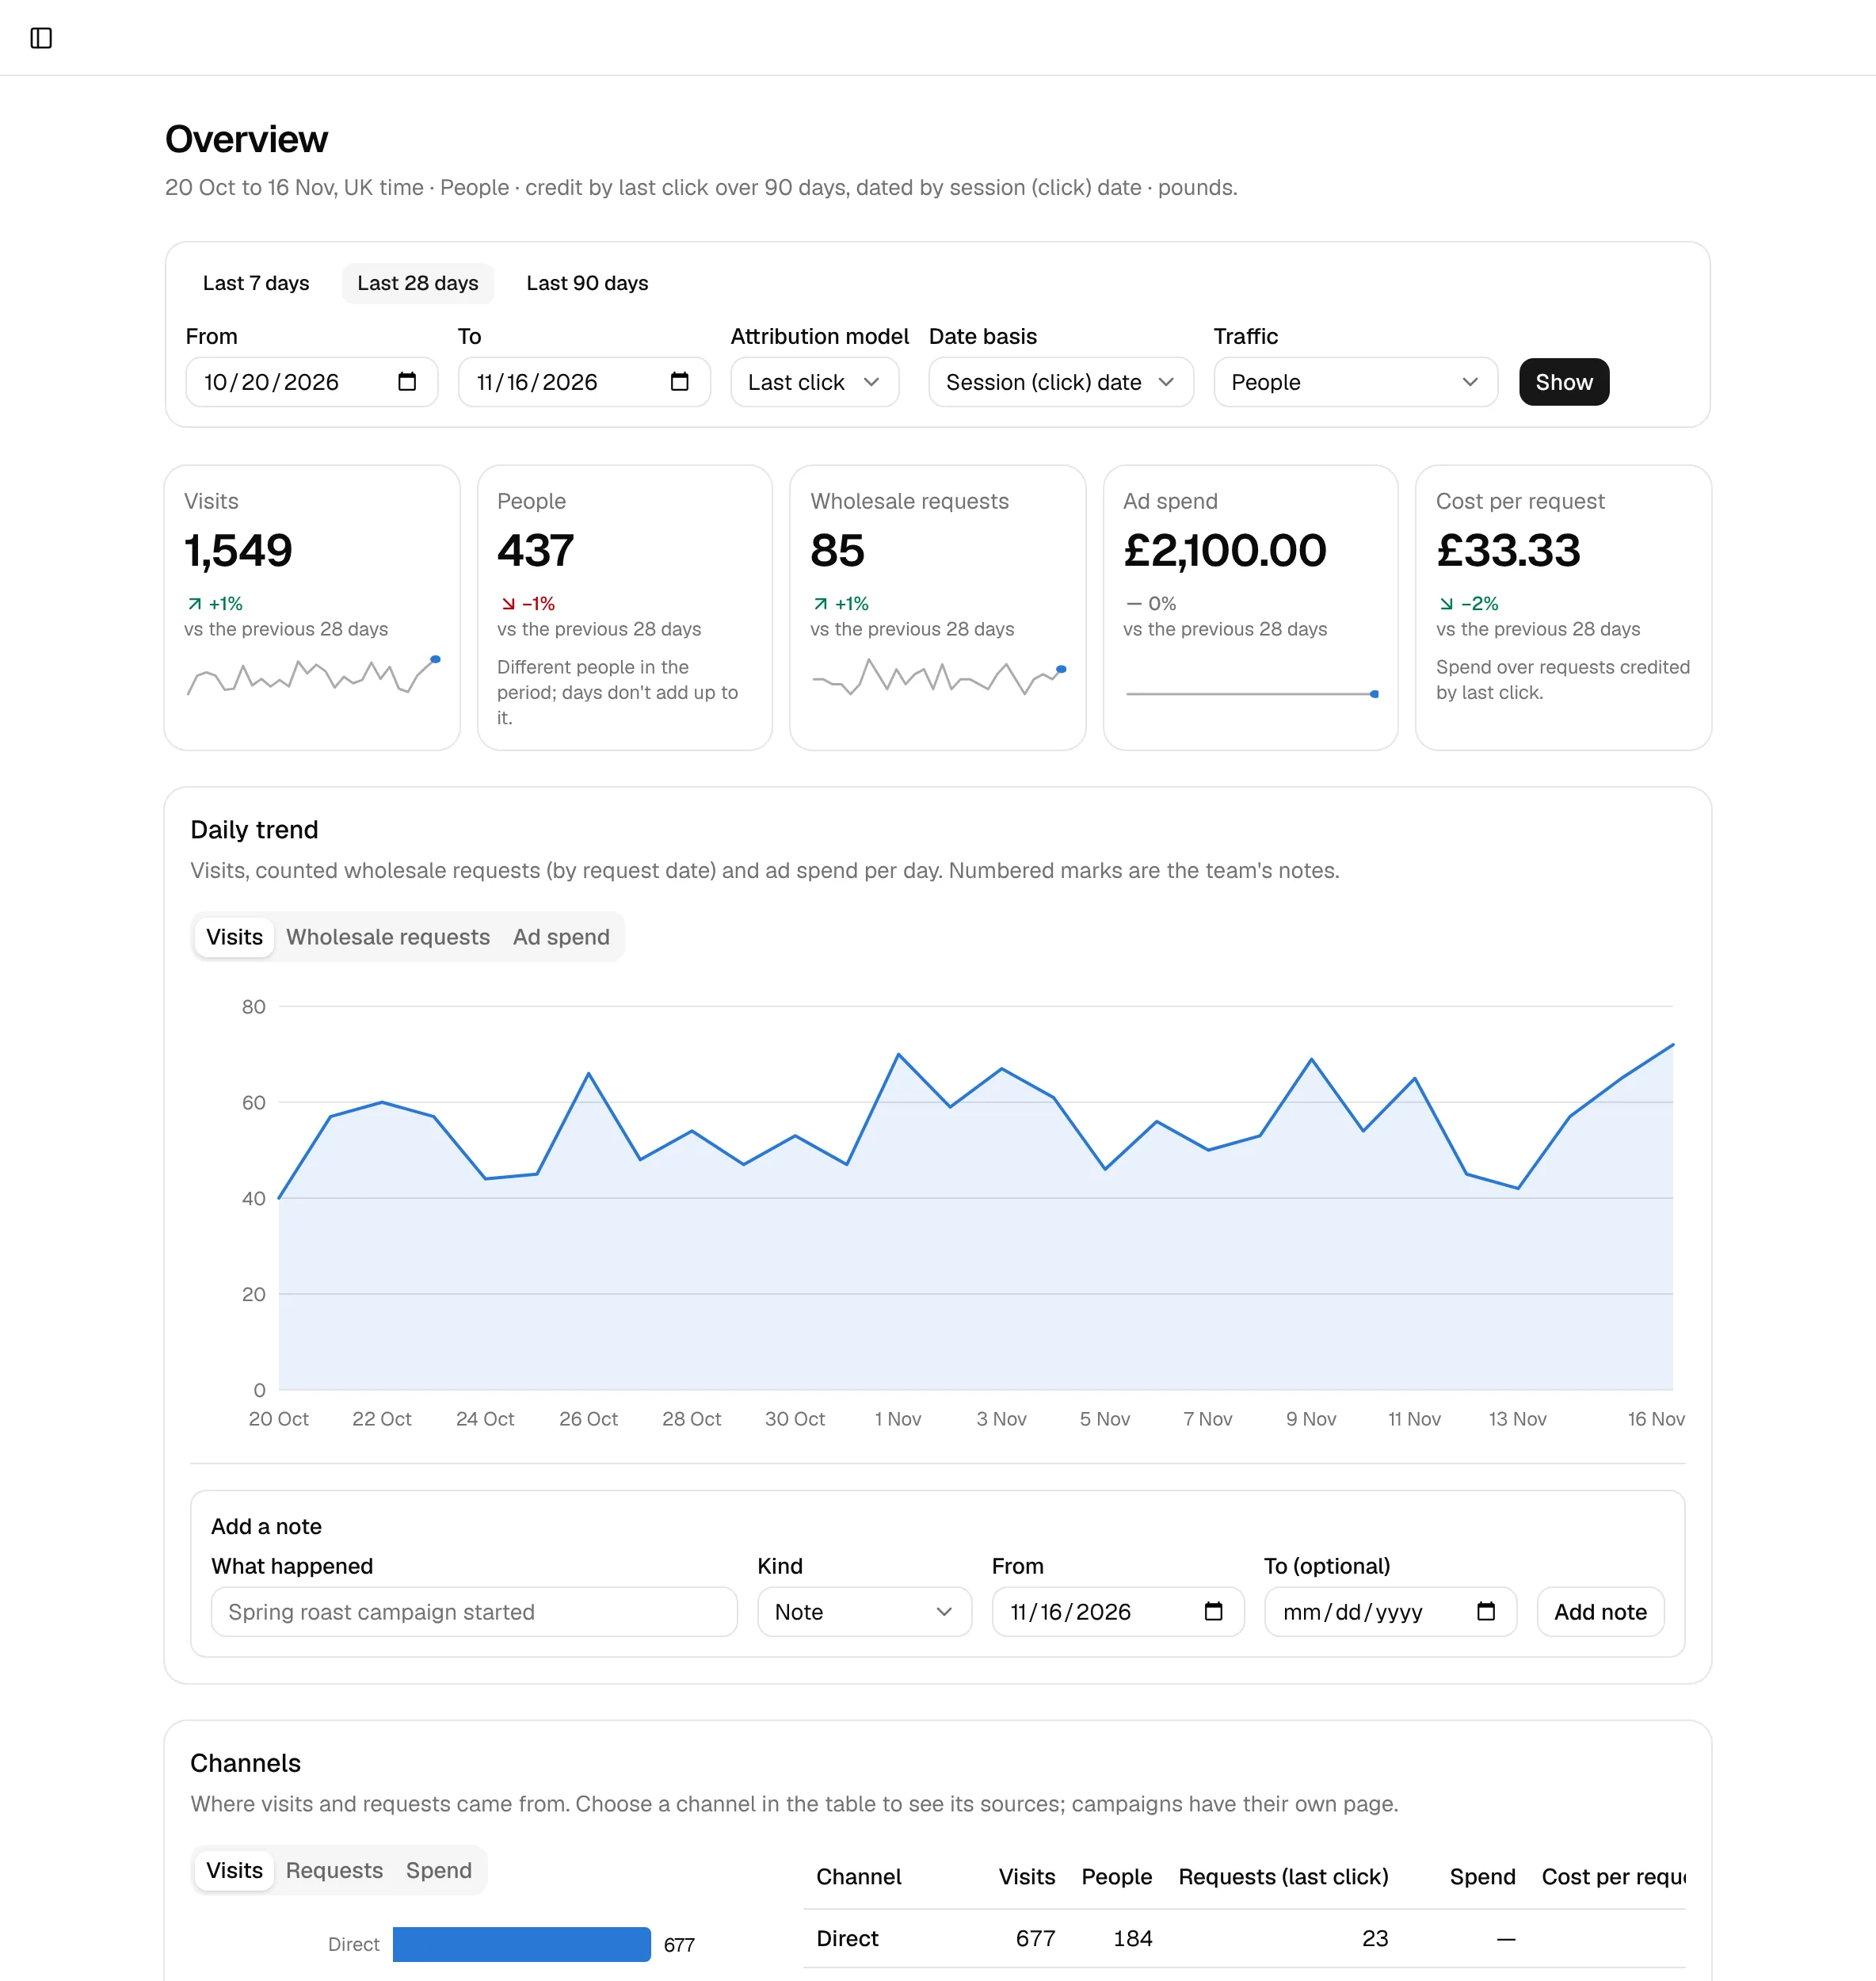
The overview answers the questions GA4 answers, on your own data and your own rules: visits, people, leads, spend and cost per lead against the previous period, a daily trend with your team's notes on it, and every channel with what it brought.
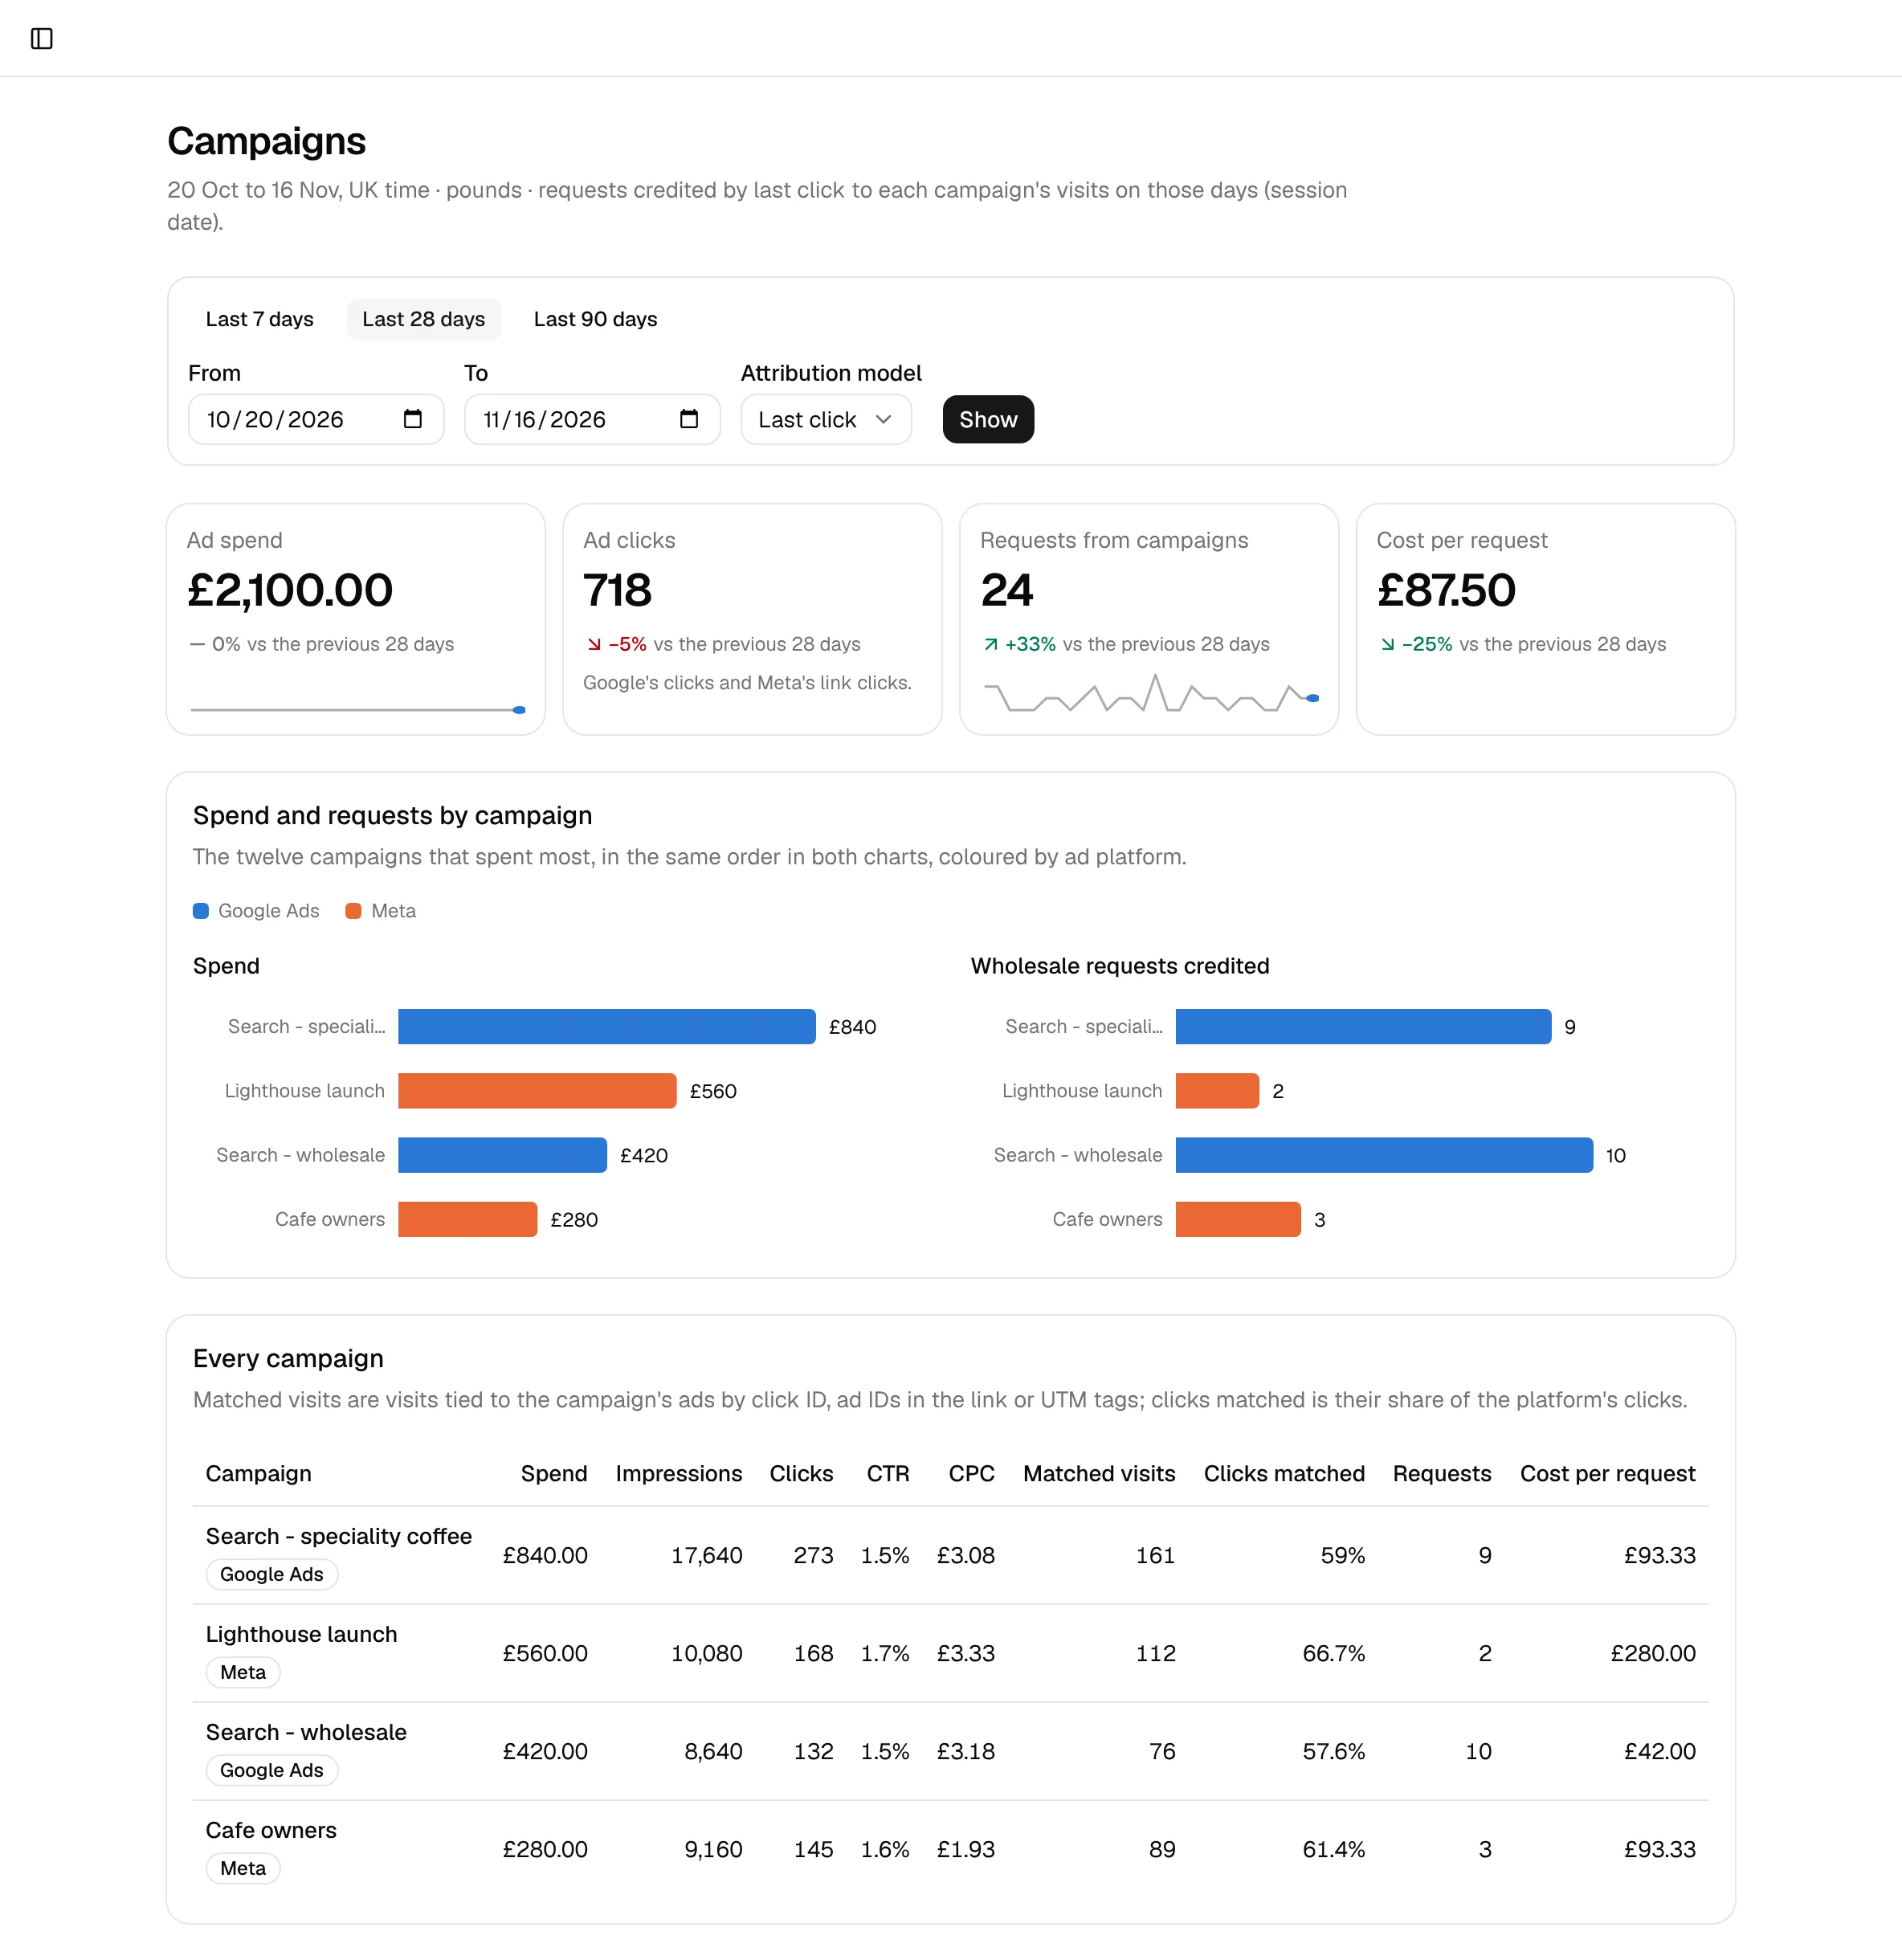
Campaigns joins your Google Ads and Meta spend to the visits it paid for and the leads that followed, with clicks, CPC, CTR and cost per lead side by side for both platforms.
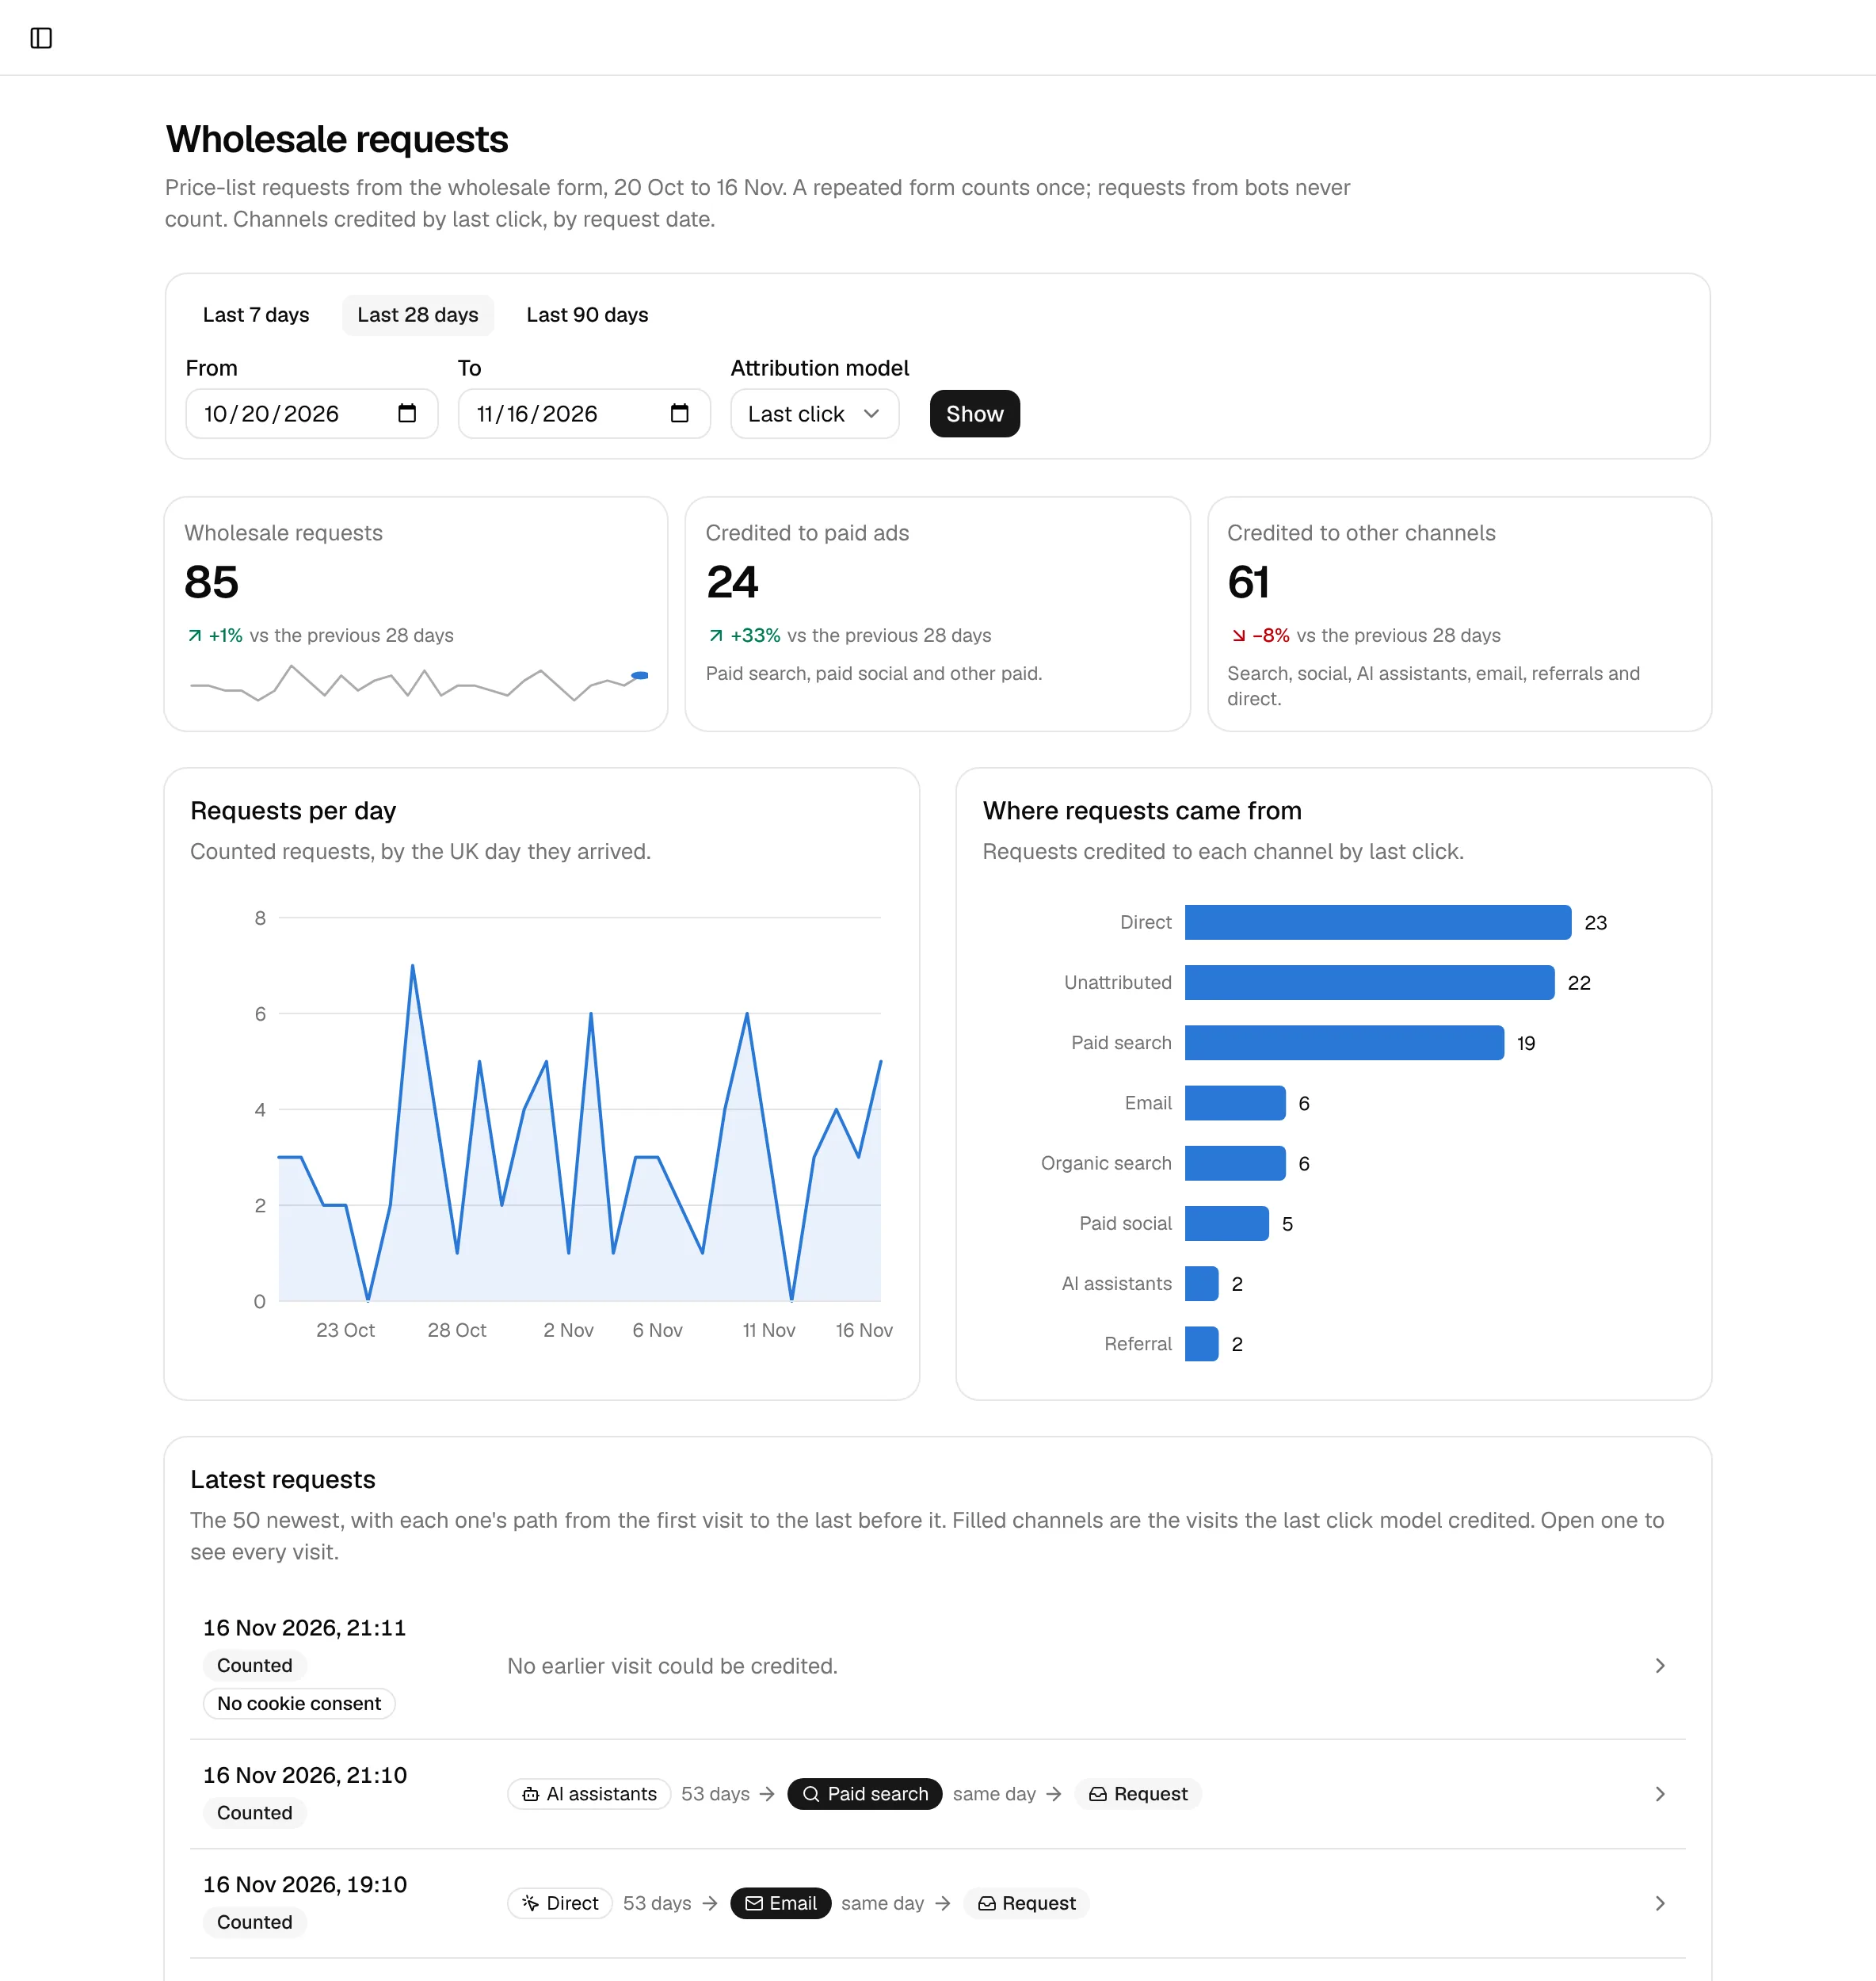
Every lead shows the path that led to it, channel by channel, with the days in between. Switch between last click and first click to see which channels open the door and which close it.
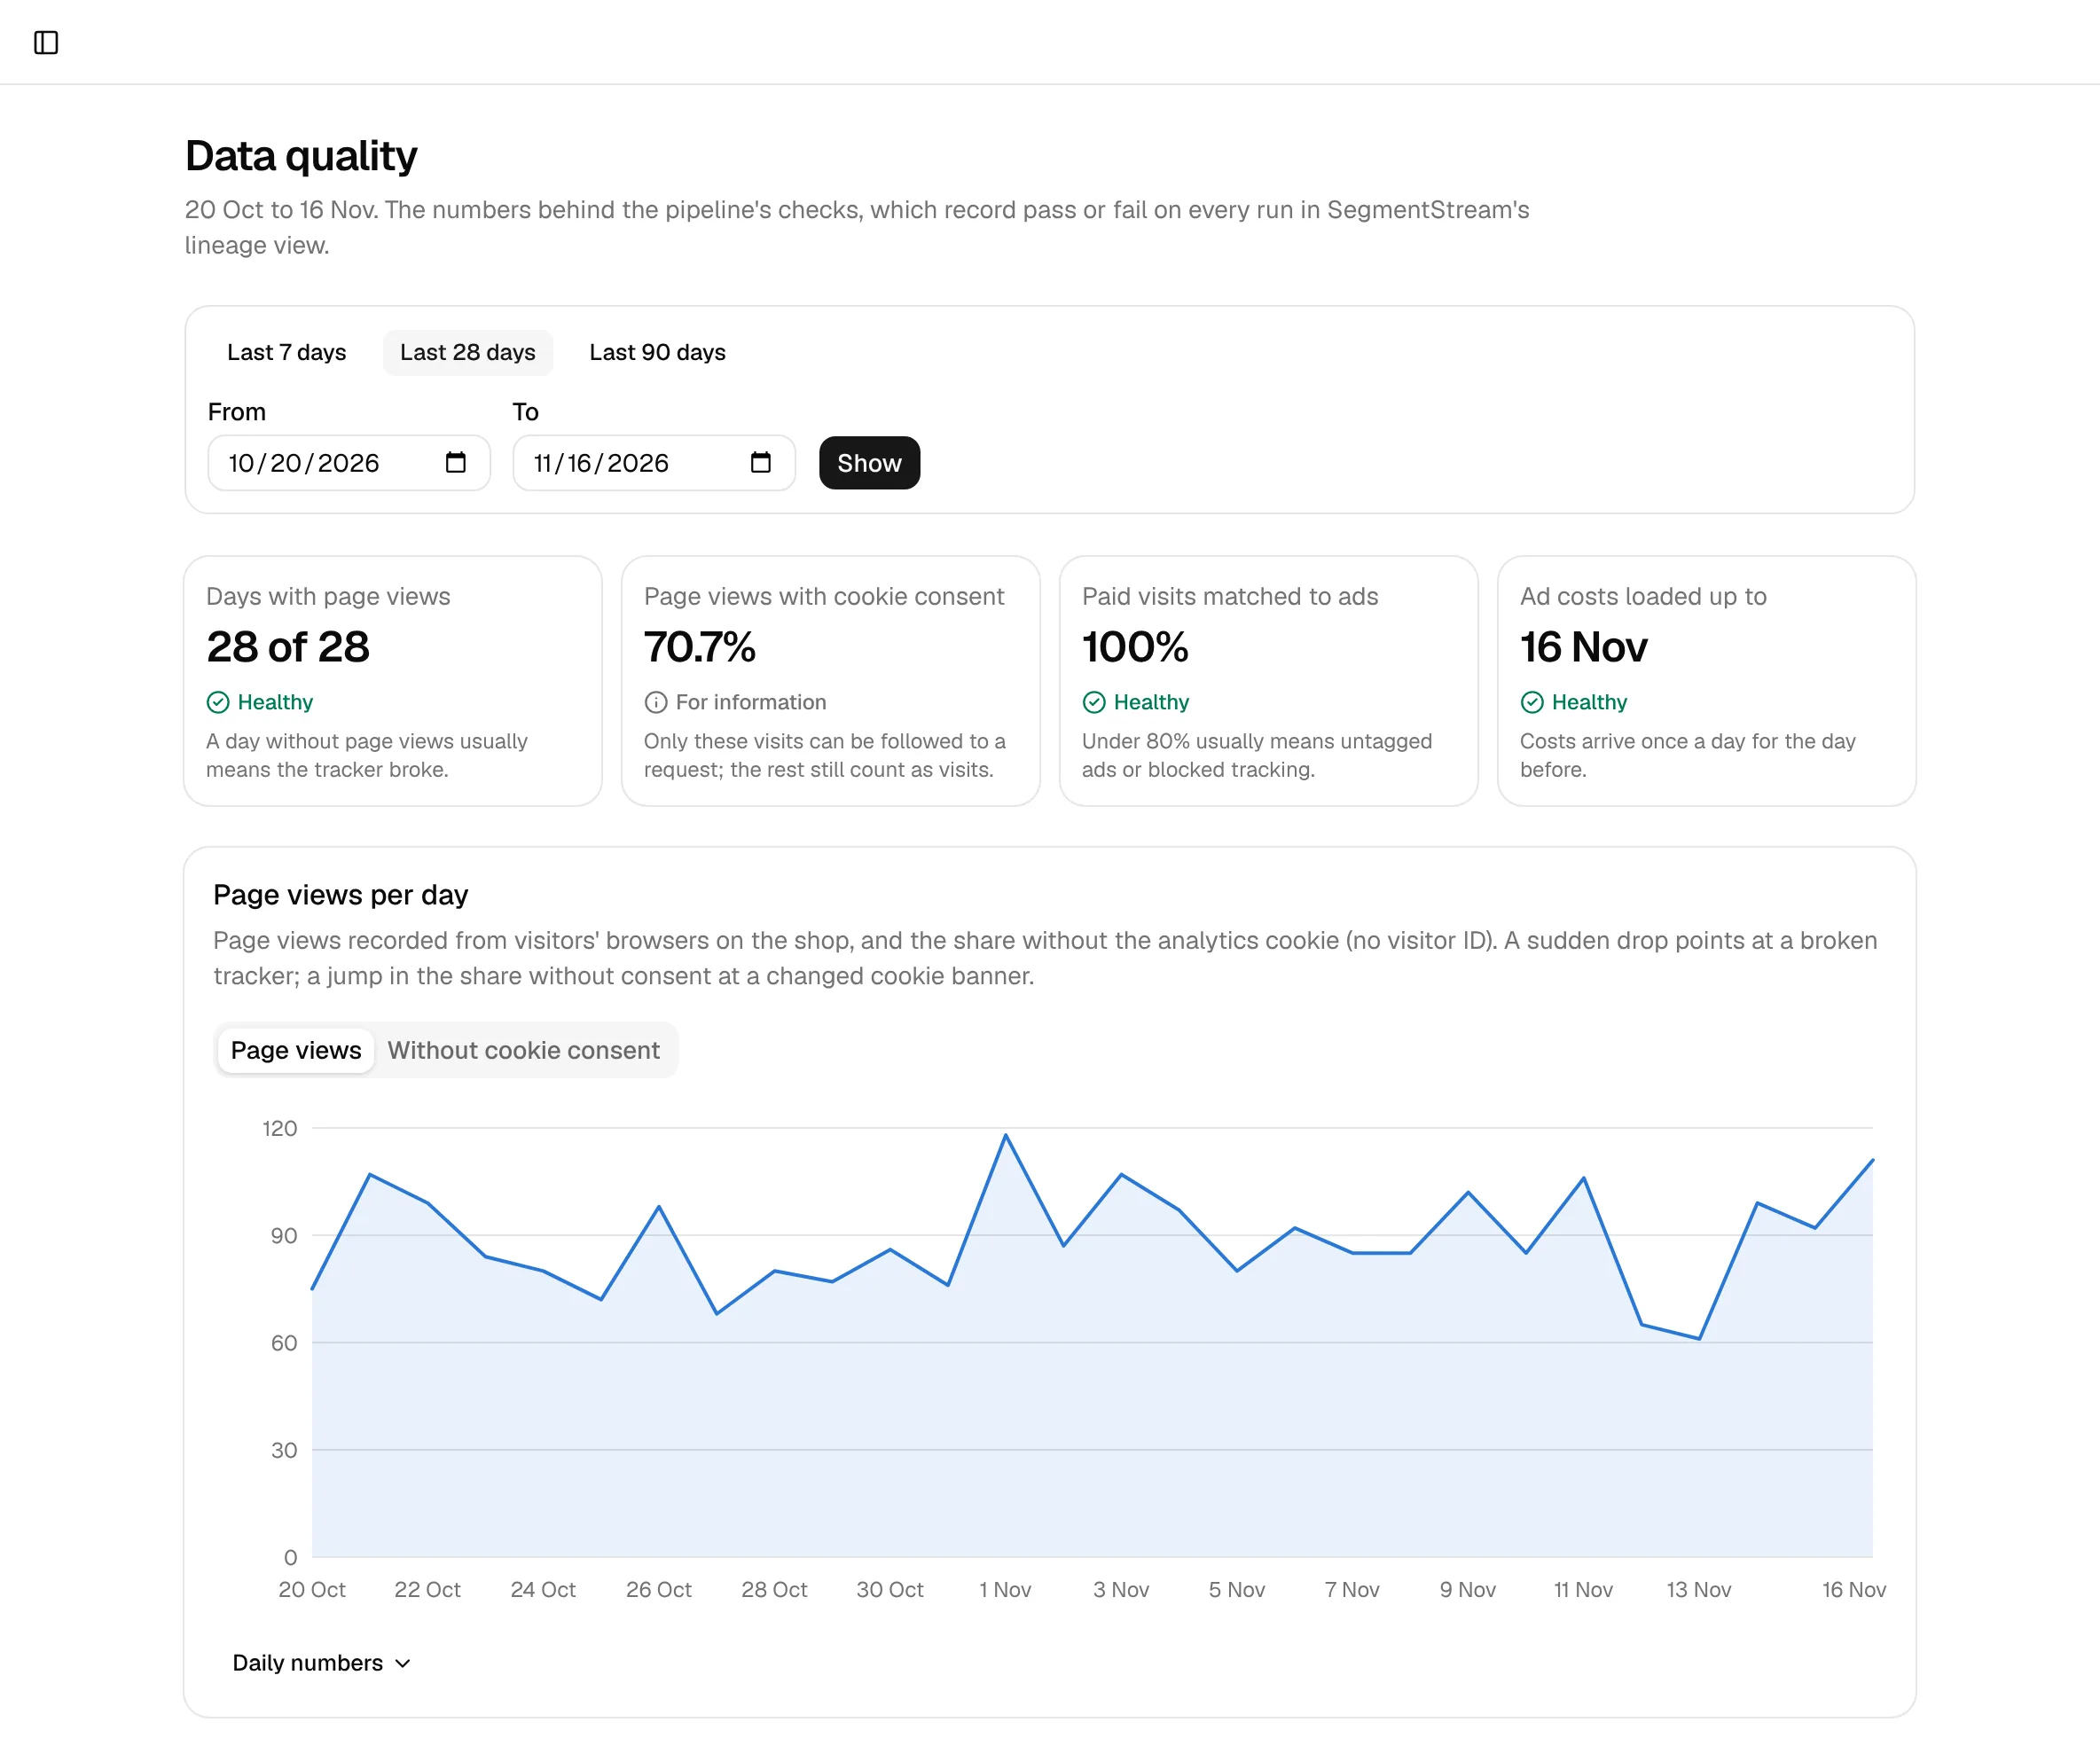
Data quality keeps the reports honest: whether the tracker sent page views every day, how many visitors accepted the cookie, how much paid traffic matched an ad, and whether the ad costs are up to date. A separate report shows which AI assistants and crawlers read your site, and an assistant in the app answers questions about the numbers in plain words.
Check before you go on
- You can sign in to the app and open every report.
- Each check in Data quality is Healthy, or you know why it is not.
Build it yourself, or have it built
Build it yourself
Request access to SegmentStream, then paste this tutorial's prompts into your coding agent. The workspace, its code and its data are yours, and you pay only for what runs.
Request accessHave us build it
Our engineers build it with you on your data in a fixed-scope pilot: the first version live in two weeks, with parity proven before anything is switched off.
Start a pilotFrequently asked questions
Do I need to write code myself?
No. Your coding agent writes it, in your website's repository and in the workspace's, and runs the SegmentStream CLI to create, check and deploy. You answer its questions, approve its plan and decide what goes live. Review the change to your website as you would any other before you publish it.
Does my website need to be hosted on SegmentStream?
No. The agent adds the tracker and the banner to your website's code wherever it lives, and you publish the site as usual. SegmentStream keeps the data, builds the reports and runs the app your team signs in to.
Does it replace Google Analytics completely?
It replaces the reports most teams use GA4 for: traffic by channel and campaign, conversions, attribution and ad spend, on your own data. It does not build remarketing audiences or send conversions back to ad platforms; if you rely on those, keep GA4 running for them.
What about cookie consent?
The agent asks before it adds anything. Ours added a banner and sets its one cookie only after a visitor accepts. Whether that is right for your visitors is a legal question, so have whoever advises you on privacy check the wording and how long the data is kept.
Where does the data live?
In your workspace, in the region you chose when you created it, for as long as you decide. Every number in the reports is built from those visits by pipelines in your workspace's repository, so any number can be traced back to the visits behind it.
Does it work with Codex or Cursor instead of Claude Code?
Yes. Both prompts are plain text that any coding agent can follow, and the work goes through the SegmentStream CLI, which every agent can run.